NCERT Solutions for Class 9 Maths Exercise 15.1 book solutions are available in PDF format for free download. These ncert book chapter wise questions and answers are very helpful for CBSE board exam. CBSE recommends NCERT books and most of the questions in CBSE exam are asked from NCERT text books. Class 9 Maths chapter wise NCERT solution for Maths Book for all the chapters can be downloaded from our website and myCBSEguide mobile app for free.
NCERT Solutions for Class 9 Mathematics Probability
1. In a cricket match a batsman hits a boundary 6 times out of 30 balls he plays. Find the probability that he will
(i) hit a boundary in the next ball.
(ii) not hit boundary in the next ball.
Ans. For all solutions, Probability = 
(i) Number of times on boundary is hit = 6
 P (hit a boundary) =
(ii) Number of times on boundary is not hit = 30 – 6 = 24
P (did not hit a boundary) = 
2. 1500 families with 2 children were selected randomly and the following data were recorded:
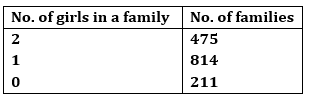
Compute the probability of a family, chosen at random, having:
(i) 2 girls (ii) 1 girl (iii) No girl
Also check whether the sum of these probabilities is 1.
Ans. (i) Total number of families = 1500
No. of families having 2 girls = 475
P (Family having 2 girls) = 
(ii) No of families having 1 girl = 814
P (Family having 1 girl) = 
(iii) No. of families having no girl = 211
P (Family having no girl) = 
Checking: Sum of all probabilities = 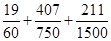
= 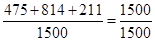 = 1
= 1
Yes, the sum of probabilities is 1.
3. In a particular section of Class IX, 40 students were asked about the months of their birth and the following graph was prepared for the data so obtained:
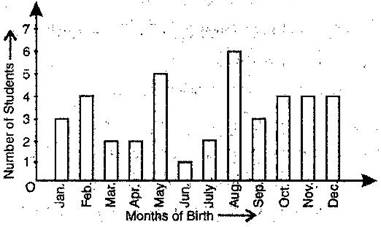
Find the probability that a student of the class was born in August.
Ans. From the bar graph, we observe,
Total no. of students of Class IX = 40
No. of students of Class IX born in August = 6
P (A student born in August) = 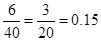
4. Three coins are tossed simultaneously 200 times with the following frequencies of different outcomes:
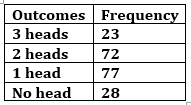
If the three coins are simultaneously tossed again, compute the probability of 2 heads coming up.
Ans. No. of 2 heads = 72
Total number of outcomes = 23 + 72 + 77 + 28 = 200
P (2 heads) = 
NCERT Solutions for Class 9 Maths Exercise 15.1
5. An organization selected 2400 families at random and surveyed them to determine a relationship between income level and the number of vehicles in a family. The information gathered is listed in the table below:
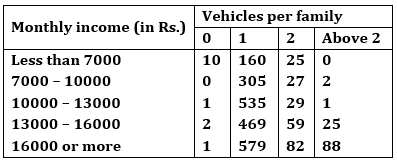
Suppose a family is chosen. Find the probability that the family chosen is:
(i) earning Rs. 10000 – 13000 per month and owning exactly 2 vehicles.
(ii) earning Rs. 16000 or more per month and owning exactly 1 vehicle.
(iii) earning less than Rs. 7000 per month and does not own any vehicle.
(iv) earning Rs. 13000 – 16000 per month and owning more than 2 vehicles.
(v) not more than 1 vehicle.
Ans. (i) P (earning Rs. 10000 – 13000 per month and owning exactly 2 vehicles) = 
(ii) P (earning Rs. 16000 or more per month and owning exactly 1 vehicles) = 
(iii) P (earning Rs. 7000 per month and does not own any vehicles) = 
(iv) P (earning Rs. 13000 – 16000 per month and owning more than 2 vehicles) = 
(v) P (owning not more than 1 vehicle) = 
NCERT Solutions for Class 9 Maths Exercise 15.1
6. A teacher analyses the performance of two sections of students in a mathematics test of 100 marks given in the following table:
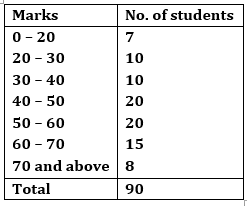
(i) Find the probability that a student obtained less than 20% in the mathematics test.
(ii) Find the probability that a student obtained 60 or above.
Ans. (i) No. of students obtaining marks less than 20 out of 100, i.e. 20% = 7
Total students in the class = 90
P (A student obtained less than 20%) = 
(ii) No. of students obtaining marks 60 or above = 15 + 8 = 23
P (A student obtained marks 60 or above) = 
NCERT Solutions for Class 9 Maths Exercise 15.1
7. To know the opinion of the students about the subject statistics, a survey of 200 students was conducted. The data is recorded in the following table:
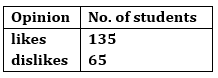
Find the probability that a student chosen at random:
(i) likes statistics (ii) dislikes it.
Ans. Total no. of students on which the survey about the subject of statistics was conducted = 200
(i) No. of students who like statistics = 135
P (a student likes statistics) = 
(ii) No. of students who do not like statistics = 65
P (a student does not like statistics) = 
NCERT Solutions for Class 9 Maths Exercise 15.1
8. Refer Q.2, Exercise 14.2. What is the empirical probability than an engineer lives:
(i) less than 7 km from her place of work?
(ii) more than or equal to 7 km from her place of work?
(iii) within  km from her place of work?
Ans. Total number of engineers = 40
(i) No. of engineers living less than 7 km from her place of work = 9
P (Engineer living less than 7 km from her place of work) = 
(ii) No. of engineers living more than or equal to 7 km from her place of work = 21
P (Engineer living more than or equal to 7 km from her place of work) = 
(iii) No. of engineers living within km from her place of work = 0
P (Engineer living within km from her place of work) =  = 0
= 0
NCERT Solutions for Class 9 Maths Exercise 15.1
9. Activity: Note the frequency of two wheelers, three wheelers and four wheelers going past during a time interval, in front of your school gate. Find the probability that any one vehicle out of the total vehicles you have observed is a two wheeler.
Ans. Let you noted the frequency of types of wheelers after school time (i.e. 3 pm to 3.30 pm) for half an hour.
Let the following table shows the frequency of wheelers.
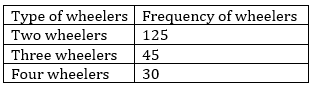
Probability that a two wheelers passes after this interval = 
NCERT Solutions for Class 9 Maths Exercise 15.1
10. Activity: Ask all the students in your class room to write a 3-digit number. Choose any student from the room at random. What is the probability that the number written by him is divisible by 3, if the sum of its digits is divisible by 3.
Ans. Let number of students in your class is 24.
Let 3-digit number written by each of them is as follows:
837, 172, 643, 371, 124, 512, 432, 948, 311, 252, 999, 557, 784, 928, 867, 798, 665, 245, 107, 463, 267, 523, 944, 314
Numbers divisible by 3 are = 837, 432, 948, 252, 999, 867, 798 and 267
Number of 3-digit numbers divisible by 3 = 8
P (3-digit numbers divisible by 3) = 
NCERT Solutions for Class 9 Maths Exercise 15.1
11. Eleven bags of wheat flour, each marked 5 kg, actually contained the following weights of four (in kg): 4.97, 5.05, 5.08, 5.03, 5.00, 5.06, 5.08, 4.98, 5.04, 5.07, 5.00
Find the probability that any of these bags chosen at random contains more than 5 kg of flour.
Ans. Number of bags containing more than 5 kg of wheat flour = 7
Total number of wheat flour bags = 11
P (a bag containing more than 5 kg of wheat flour) = 
NCERT Solutions for Class 9 Maths Exercise 15.1
12. In Q.5, Exercise 14.2, you were asked to prepare a frequency distribution table, regarding the concentration of Sulphur dioxide in the air in parts per million of a certain city for 30 days. Using this table, find the probability of the concentration of Sulphur dioxide in the interval 0.12 – 0.16 on any of these days.
Ans. From the frequency distribution table we observe that:
No. of days during which the concentration of Sulphur dioxide lies in interval 0.12 – 0.16 = 2
Total no. of days during which concentration of Sulphur dioxide recorded = 30
P (day when concentration of Sulphur dioxide (in ppm) lies in 0.12 – 0.16) = 
NCERT Solutions for Class 9 Maths Exercise 15.1
13. In Q.1, Exercise 14.1 you were asked to prepare a frequency distribution table regarding the blood groups of 30 students of a class. Use this table to determine the probability that a student of this class selected at random has blood group AB.
Ans. From the frequency distribution table we observe that:
Number of students having blood group AB = 3
Total number of students whose blood group were recorded = 30
P (a student having blood group AB) = 
NCERT Solutions for Class 9 Maths Exercise 15.1
NCERT Solutions for Class 9 Maths PDF (Download) Free from myCBSEguide app and myCBSEguide website. Ncert solution class 9 Maths includes text book solutions from Mathematics Book. NCERT Solutions for CBSE Class 9 Maths have total 15 chapters. 9 Maths NCERT Solutions in PDF for free Download on our website. Ncert Maths class 9 solutions PDF and Maths ncert class 9 PDF solutions with latest modifications and as per the latest CBSE syllabus are only available in myCBSEguide.
CBSE app for Class 9
To download NCERT Solutions for Class 9 Maths, Computer Science, Home Science,Hindi ,English, Social Science do check myCBSEguide app or website. myCBSEguide provides sample papers with solution, test papers for chapter-wise practice, NCERT solutions, NCERT Exemplar solutions, quick revision notes for ready reference, CBSE guess papers and CBSE important question papers. Sample Paper all are made available through the best app for CBSE students and myCBSEguide website.
Test Generator
Create question paper PDF and online tests with your own name & logo in minutes.
Create Now
Learn8 App
Practice unlimited questions for Entrance tests & government job exams at ₹99 only
Install Now