NCERT Solutions for Class 7 Maths Exercise 3.3 book solutions are available in PDF format for free download. These ncert book chapter wise questions and answers are very helpful for CBSE exam. CBSE recommends NCERT books and most of the questions in CBSE exam are asked from NCERT text books. Class 7 Maths chapter wise NCERT solution for Maths Book all the chapters can be downloaded from our website and myCBSEguide mobile app for free.
NCERT solutions for Maths Data Handling Download as PDF
NCERT Solutions for Class 7 Maths Data Handling
Class –VII Mathematics (Ex. 3.3)
Question 1.Use the bar graph to answer the following questions:
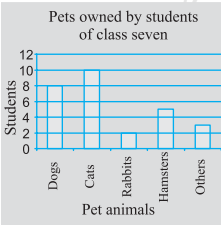
(a)Which is the most popular pet?
(b)How many students have dog as a pet?
Answer:
(a) Cat is the most popular pet.
(b) 8 students have dog as a pet.
NCERT Solutions for Class 7 Maths Exercise 3.3
Question 2.Read the bar graph which shows the number of books sold by a bookstore during five consecutive years and answer the following questions:
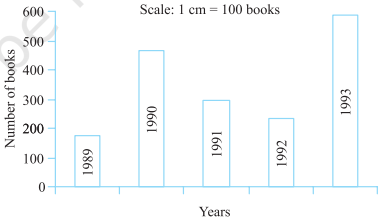
(i)About how many books were sold in 1989? 1990? 1992?
(ii)In which year were about 475 books sold? About 225 books sold?
(iii)In which years were fewer than 250 books sold?
(iv)Can you explain how you would estimate the number of books sold in 1989?
Answer:
According to the given bar graph,
(i)(a) In 1989, 180 books were sold.
(b) In 1990, 475 books were sold.
(c) In 1992, 225 books were sold.
(ii)In 1990, about 475 books were sold and in 1992, about 225 books were sold.
(iii)In 1989 and 1992 fewer than 250 books were sold.
(iv)By reading the graph, we calculate that 180 books were sold in 1989.
NCERT Solutions for Class 7 Maths Exercise 3.3
Question 3.Number of children in six different classes are given below. Represent the data on a bar graph.
| Class | Fifth | Sixth | Seventh | Eighth | Ninth | Tenth |
| No. of children | 135 | 120 | 95 | 100 | 90 | 80 |
(a)How would you choose a scale?
(b)Answer the following questions:
(i)Which class has the maximum number of children? And the minimum?
(ii)Find the ratio of students of class sixth to the students of class eighth.
Answer:
Data represented by the bar graph is as follows:
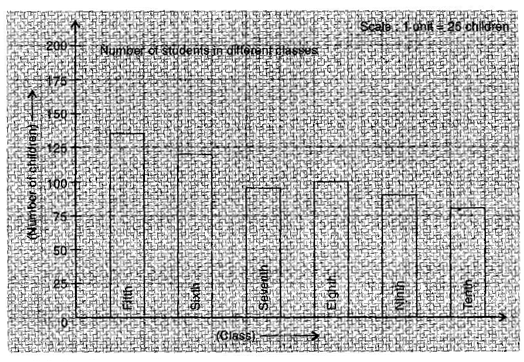
(a)Scale: 1 unit = 25 children
(b)(i) Fifth class has the maximum number of children and
Tenth class has the minimum number of children.
(ii) Ratio = {tex}\frac{{{\text{Number of students in class sixth}}}}{{{\text{Number of students in class eighth}}}}{/tex}
= {tex}\frac{{120}}{{100}}{/tex} = {tex}\frac{6}{5}{/tex} = 6 : 5
NCERT Solutions for Class 7 Maths Exercise 3.3
Question 4.The performance of a student in 1st term and 2nd term is given. Draw a double bar graph choosing appropriate scale and answer the following:
| Subject | English | Hindi | Maths | Science | S. Science |
| 1st term (MM. 100) | 67 | 72 | 88 | 81 | 73 |
| 2nd term (MM (100) | 70 | 65 | 95 | 85 | 75 |
(i)In which subject has the child improved his performance the most?
(ii) In which subject is the improvement the least?
(iii)Has the performance gone down in any subject?
Answer:
Data represented by bar graph is as follows:
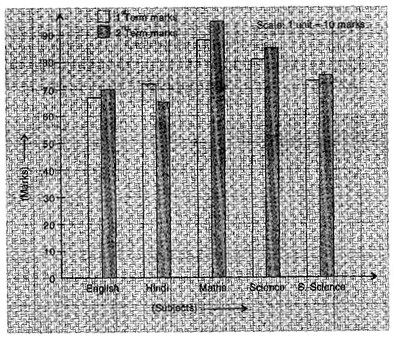
Difference of marks of 1st term and 2nd term
English = 70 – 67 = 3 Hindi = 65 – 72 = {tex} – 7{/tex} Maths = 95 – 88 = 7
Science = 85 – 81 = 4 S. Science = 75 – 73 = 2
(i) He has most improved in Maths subject.
(ii) In S. Science subject, his improvement is less.
(iii) Yes, in Hindi subject, his performance has gone down.
NCERT Solutions for Class 7 Maths Exercise 3.3
Question 5.Consider this data collected from a survey of a colony.
| Favourite Sport | Cricket | Basket Ball | Swimming | Hockey | Athletics |
| Watching | 1240 | 470 | 510 | 423 | 250 |
| Participating | 620 | 320 | 320 | 250 | 105 |
(i) Draw a double bar graph choosing an appropriate scale. What do you infer from the bar graph?
(ii) Which sport is most popular?
(iii) Which is more preferred, watching or participating in sports?
Answer:
Data represented by the double bar graph is as follows:
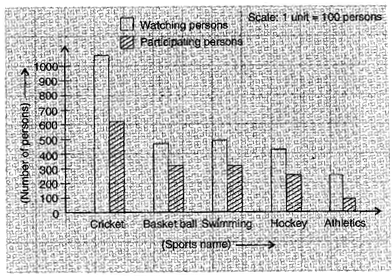
(i)This bar graph represents the number of persons who are watching and participating in their favourite sports.
(ii)Cricket is most popular.
(iii)Watching sports is more preferred.
NCERT Solutions for Class 7 Maths Exercise 3.3
Question 6.Take the data giving the minimum and the maximum temperature of various cities given in the beginning of this Chapter. Plot a double bat graph using the data and answer the following:
Temperature of Cities as on 20.6.2006
| City | Ahmedabad | Amritsar | Bangalore | Chennai |
| Max. | {tex}{38^o}C{/tex} | {tex}{37^o}C{/tex} | {tex}{28^o}C{/tex} | {tex}{36^o}C{/tex} |
| {tex}{29^o}C{/tex} | {tex}{26^o}C{/tex} | {tex}{21^o}C{/tex} | {tex}{27^o}C{/tex} | |
| Min. | ||||
| City | Delhi | Jaipur | Jammu | Mumbai |
| Max. | {tex}{38^o}C{/tex} | {tex}{39^o}C{/tex} | {tex}{41^o}C{/tex} | {tex}{32^o}C{/tex} |
| {tex}{29^o}C{/tex} | {tex}{29^o}C{/tex} | {tex}{26^o}C{/tex} | {tex}{27^o}C{/tex} | |
| Min. |
(i) Which city has the largest difference in the minimum and maximum temperature on the given data?
(ii) Which is the hottest city and which is the coldest city?
(iii) Name two cities where maximum temperature of one was less than the minimum temperature of the order.
(iv) Name the city which has the least difference between its minimum and the maximum temperature.
Answer:
Data represented by double bar graph is as follows:
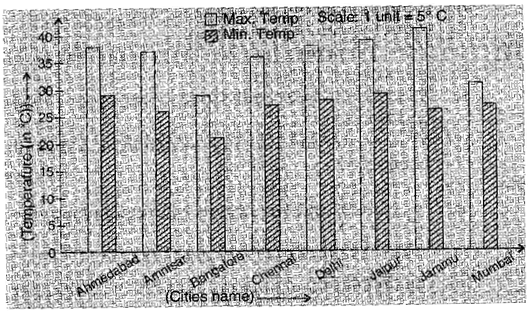
(i)Jammu has the largest difference in temperature i.e., Maximum temperature = {tex}{41^o}C{/tex} and Minimum temperature ={tex}{26^o}C{/tex}.
{tex}\therefore {/tex} Difference = {tex}{41^o}C{\text{ }}–{\text{ }}{26^o}C{\text{ }} = {\text{ }}{15^o}C{/tex}
(ii)Jammu is the hottest city due to maximum temperature is high and Bangalore is the coldest city due to maximum temperature is low.
(iii)Maximum temperature of Bangalore {tex} – {\text{ }}{28^o}C{/tex}
Minimum temperature of two cities whose minimum temperature is higher than the maximum temperature of Bangalore are Ahemedabad and Jaipur = {tex}{29^o}C{/tex}
(iv)Mumbai has the least difference in temperature i.e., Maximum temperature = {tex}{32^o}C{/tex} and Minimum temperature = {tex}{27^o}C{/tex}
{tex}\therefore {/tex} Difference = {tex}{32^o}C{\text{ }}–{\text{ }}{27^o}C{\text{ }} = {\text{ }}{5^o}C{/tex}
NCERT Solutions for Class 7 Maths Exercise 3.3
NCERT Solutions Class 7 Maths PDF (Download) Free from myCBSEguide app and myCBSEguide website. Ncert solution class 7 Maths includes text book solutions from Class 7 Maths Book . NCERT Solutions for CBSE Class 7 Maths have total 15 chapters. 7 Maths NCERT Solutions in PDF for free Download on our website. Ncert Maths class 7 solutions PDF and Maths ncert class 7 PDF solutions with latest modifications and as per the latest CBSE syllabus are only available in myCBSEguide.
CBSE app for Students
To download NCERT Solutions for Class 7 Maths, Social Science Computer Science, Home Science, Hindi English, Maths Science do check myCBSEguide app or website. myCBSEguide provides sample papers with solution, test papers for chapter-wise practice, NCERT solutions, NCERT Exemplar solutions, quick revision notes for ready reference, CBSE guess papers and CBSE important question papers. Sample Paper all are made available through the best app for CBSE students and myCBSEguide website.
Test Generator
Create question paper PDF and online tests with your own name & logo in minutes.
Create Now
Learn8 App
Practice unlimited questions for Entrance tests & government job exams at ₹99 only
Install Now