2. The distance (in km) of …

CBSE, JEE, NEET, CUET
Question Bank, Mock Tests, Exam Papers
NCERT Solutions, Sample Papers, Notes, Videos
2. The distance (in km) of 40 engineers from their residence to their place of work were found as follows:
5 3 10 20 25 11 13 7 12 31
19 10 12 17 18 11 32 17 16 2
7 9 7 8 3 5 12 15 18 3
12 14 2 9 6 15 15 7 6 12
Construct a grouped frequency distribution table with class size 5 for the data given above taking the first interval as 0-5 (5 not included). What main features do you observe from this tabular representation
Posted by Ankush Sharma 5 years, 3 months ago
- 1 answers
Related Questions
Posted by Yash Pandey 8 months, 1 week ago
- 0 answers
Posted by Duruvan Sivan 8 months, 1 week ago
- 0 answers
Posted by Alvin Thomas 5 months ago
- 0 answers
Posted by Sheikh Alfaz 3 months, 3 weeks ago
- 0 answers
Posted by Savitha Savitha 1 year, 6 months ago
- 0 answers
Posted by Akhilesh Patidar 1 year, 6 months ago
- 0 answers

myCBSEguide
Trusted by 1 Crore+ Students

Test Generator
Create papers online. It's FREE.

CUET Mock Tests
75,000+ questions to practice only on myCBSEguide app
 myCBSEguide

Gaurav Seth 5 years, 3 months ago
The distance (in km) of 40 engineers from their residence to their place of work were found as follows:
5 3 10 20 25 11 13 7 12 31
19 10 12 17 18 11 32 17 16 2
7 9 7 8 3 5 12 15 18 3
12 14 2 9 6 15 15 7 6 12
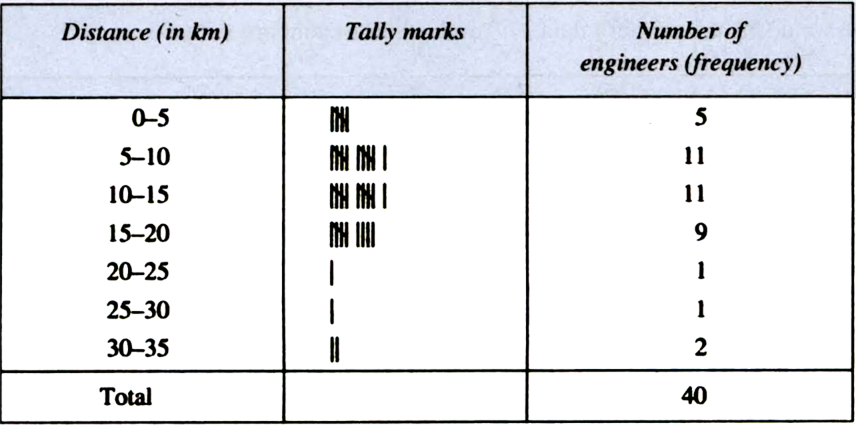
Construct a grouped frequency distribution table with class size 5 for the data given above, taking the first interval as 0–5 (5 not included). What main features do you observe from this tabular representation ?
<hr />(i)

We observe the following main features from this tabular representation:
(i) The distances (in km) from their residence to their work place of the maximum number of engineers are in the third interval, i.e., 10–15.
(ii) The distances (in km) from their residence to their work place of the minimum number of engineers are in the intervals 20–25 and 25–30 each.
(iii) The frequencies of the intervals 20–25 and 25–30 are the same. (Each = 1)
0Thank You