
Plot the graph showing the variation …

CBSE, JEE, NEET, CUET
Question Bank, Mock Tests, Exam Papers
NCERT Solutions, Sample Papers, Notes, Videos
 Test
Test
Related Questions
Posted by Aniket Mahajan 1 year ago
- 0 answers
Posted by Anterpreet Kaur 1 year, 8 months ago
- 0 answers
Posted by Khushbu Otti 1 year, 7 months ago
- 0 answers
myCBSEguide
Trusted by 1 Crore+ Students

Test Generator
Create papers online. It's FREE.
![]()
CUET Mock Tests
75,000+ questions to practice only on myCBSEguide app

Gaurav Seth 6 years, 8 months ago
Force between charged particles is given by,
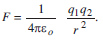
 is a straight line of slope passing through the origin.
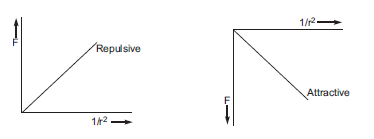
The graph between F and
Magnitude of slope is more for attraction, therefore attractive force is greater than the repulsive force.
0Thank You