
Explain the concept of aggregate supply …

CBSE, JEE, NEET, CUET
Question Bank, Mock Tests, Exam Papers
NCERT Solutions, Sample Papers, Notes, Videos
Posted by Vidit Arora 6 years, 10 months ago
- 1 answers
 Test
Test
Related Questions
Posted by Mehar Ansari 1 year, 9 months ago
- 0 answers
Posted by Naman Jain 1 year, 8 months ago
- 1 answers
Posted by Dipika Sharma 1 year, 9 months ago
- 0 answers
Posted by Rijum Karlo 1 year, 9 months ago
- 0 answers
Posted by Sakshi Singh 8 months, 3 weeks ago
- 1 answers
Posted by Niyati Garg 1 year, 8 months ago
- 0 answers
Posted by Shruti Singh 1 year, 9 months ago
- 0 answers
Posted by Nandita Sharma 1 year, 9 months ago
- 1 answers
myCBSEguide
Trusted by 1 Crore+ Students

Test Generator
Create papers online. It's FREE.
![]()
CUET Mock Tests
75,000+ questions to practice only on myCBSEguide app

Gaurav Seth 6 years, 10 months ago
Aggregate supply is the money value of total output available in the economy for purchase during a given period. When expressed in physical terms, aggregate supply refers to the total output of goods and services produced for sale by all the entrepreneurs in an economy. It is assumed that in short-run, prices of goods do not change and elasticity of supply is infinite. At the given price level, output can be increased till all the resources are fully employed.
If we go deep, we will find aggregate supply is represented by national income. How? We know that money value of final output is distributed as rent, wages interest and profit among factors of production who help produce the output. Since sum of factor incomes (rent, wages, interest and profit) at national level is called national income, therefore, aggregate supply, output and national income are same. Alternatively AS = Y where Y is national income. Thus income or total output measures the aggregate supply of goods and services.
Aggregate Supply = Output = Income
A major portion of income is spent on consumption of goods and services and the balance is saved. Thus national income or aggregate supply (AS) is sum of consumption expenditure (C) and savings (S). Put in the form of an equation:
AS = C + S
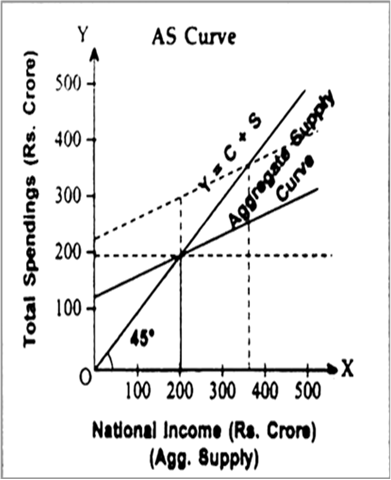
Clearly aggregate supply has two components, namely, consumption expenditure and savings. AS curve is depicted in the adjoining Fig.(a) Aggregate supply or national income is shown on X-axis and total spending (consumption + savings) on Y-axis.
AS curve is shown by a 45° line from the origin. Why? Its significance is that every point on this line is equidistant from X-axis and Y-axis taking same scale on both the axes, i.e., at each point on this line, Expenditure (AD) = Income (AS,). Thus 45° line (also called a Guideline) helps us to identify equilibrium when two variables are to be shown graphically equal,
(Classical and Keynesian concepts of Aggregate Supply. There is difference between these two concepts. According to Classicals "Aggregate supply is perfectly inelastic with respect to prices and it (aggregate supply) is always at full employment level of output." According to Keynes "Aggregate supply is perfectly elastic with respect to prices till the full employment level of output is reached.").
Fig.(a)
0Thank You