
Ask questions which are clear, concise and easy to understand.
Ask QuestionPosted by Bhavin Machhi 3 years, 1 month ago
- 1 answers
Posted by Benjamin Rong 3 years, 1 month ago
- 0 answers
Posted by Moon Moon 3 years, 1 month ago
- 1 answers
Posted by Marta Basumatary 3 years, 1 month ago
- 0 answers
Posted by Kaushiki Sharma 3 years, 1 month ago
- 1 answers
Kaushiki Sharma 3 years, 1 month ago
Posted by Tanishka Moonat 3 years, 1 month ago
- 0 answers
Posted by Ayesha Rehan 3 years, 1 month ago
- 1 answers
Preeti Dabral 3 years, 1 month ago
Consumer Awareness is an act of making sure the buyer or consumer is aware of the information about products, goods, services, and consumers rights. Consumer awareness is important so that buyer can take the right decision and make the right choice.
Posted by Ayesha Rehan 3 years, 1 month ago
- 0 answers
Posted by Rajeswari Ponnapalli 3 years, 1 month ago
- 0 answers
Posted by Gurjot Singh Jot 3 years, 1 month ago
- 0 answers
Posted by Xyz .. 3 years, 1 month ago
- 0 answers
Posted by Vanisha Khanna 3 years, 1 month ago
- 1 answers
Posted by Daljit Singh 3 years, 1 month ago
- 1 answers
Posted by Arjun Sirohi 3 years, 2 months ago
- 0 answers
Posted by Aiman Asif 3 years, 2 months ago
- 1 answers
Preeti Dabral 3 years, 2 months ago
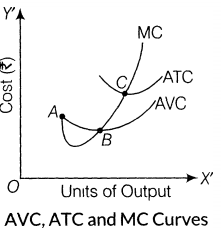
- All the three curves are U-shaped due to the law of variable proportion.
- Marginal Cost curve cut both Average total cost and Average variable cost from their lowest point.
Posted by Yeshu Rajput 3 years, 2 months ago
- 1 answers
Parshant Kumar 3 years ago
Posted by Callista Tonglim 3 years, 2 months ago
- 1 answers
Preeti Dabral 3 years, 2 months ago
Economic activities refer to those activities which are undertaken to earn living. Every economy undertakes 3 main economic activities:
Consumption: It is an economic activity as it deals with the use of goods and services for the satisfaction of human wants.
Production: it is an economic activity as it is undertaken to produce goods and services for genration of income and satisfying human wants.
Distribution: it is an economic activity which studies how income generated is distributed among the factors of production.
Posted by Shruthiga Subramanian 3 years, 2 months ago
- 1 answers
Posted by Sumit Sharma 0117 X-A 3 years, 2 months ago
- 1 answers
Preeti Dabral 3 years, 2 months ago
A bar graph represents data using a series of bars across two axes. The x-axis (the horizontal) classifies the data by group, with one bar for each group. So for example, if you were displaying the number of beads of each color in a jar, the x-axis would have a section for each color, and each color would have its own bar. The y-axis (the vertical) shows the value for the category for each bar. In the bead example, this would be the number of beads. So the bar for green beads might extend up to five, for example, whereas the bar for red beads may extend up to only two. The y-axis can be many different values, though; for example, money, a growth rate, an average speed or even a percentage of the whole. Similarly, the x-axis values and bars could represent the same quantity at different points in time, and this capability shows a big difference between bar graphs and pie charts.
Pie charts are circular graphs that display percentages of a whole as if they were slices of a pie. This is very similar to bar graphs in that the individual slices of pie mean that the data has to have the potential to be categorized. The “slices” of the pie have sizes to indicate the proportion of the whole they represent (although a legend beside the chart usually shows the precise figures), but unlike bar graphs, pie charts can’t be used to explicitly show absolute number values for each group. The shape is the most obvious difference between pie charts and bar graphs, but the restriction to proportions with pie charts is the most important
Posted by Nikita Singh 3 years, 2 months ago
- 1 answers
Preeti Dabral 3 years, 2 months ago
The quantity of an item that a producer intends to sell in the market is referred to as supply. Price, the number of suppliers, the state of technology, government subsidies, weather conditions, and the availability of employees, and many more, all can influence supply.
Posted by Meena Chauhan 3 years, 2 months ago
- 1 answers
Preeti Dabral 3 years, 2 months ago
Price elasticity of supply (PES) measures the relationship between change in quantity supplied following a change in price.
ES {tex}=\frac{\Delta Q}{\Delta P} \times \frac{P}{Q}{/tex}
{tex}\Delta{/tex}P = 5 - 4 = Rs.1
Total Revenue = 600
P {tex}\times{/tex} Q = 600
4 {tex}\times{/tex} Q = 600
Q {tex}=\frac{600}{4}{/tex} = 150 units
Total Revenue when price increase = Rs.750
P1 {tex}\times{/tex} Q1 = Rs.750
Q1 {tex}\times{/tex} 5 = Rs.750
Q1 {tex}=\frac{750}{5}{/tex} = 150
ES {tex}=\frac{\Delta Q}{\Delta P} \times \frac{P}{Q}{/tex}
{tex}\Delta{/tex}Q = Q1 - Q
{tex}\Delta{/tex}Q = 150 - 150 = 0
{tex}\Delta{/tex}P = P1 - P
{tex}\Delta{/tex}P = Rs.5 - Rs.4 = 1
ES {tex}=\frac{0}{1} \times \frac{4}{150}{/tex}
ES = 0
Posted by Ukesh .G 3 years, 2 months ago
- 1 answers
Preeti Dabral 3 years, 2 months ago
If the price remains constant, MR also remains constant and coincides with AR. Under perfect competition as the price is constant, AR is equal to MR and their shape will be straight line horizontal to X-axis. When a firm sells large quantities at lower prices both AR and MR will fall.
Posted by Vatsala Bhatia 3 years, 2 months ago
- 1 answers
Aryaman Rana 3 years, 2 months ago

myCBSEguide
Trusted by 1 Crore+ Students

Test Generator
Create papers online. It's FREE.
![]()
CUET Mock Tests
75,000+ questions to practice only on myCBSEguide app

Hemant Sharma 3 years, 1 month ago
1Thank You