
Ask questions which are clear, concise and easy to understand.
Ask QuestionPosted by Anvitha 1317 5 years, 6 months ago
- 1 answers
Posted by Palak Gupta 5 years, 6 months ago
- 1 answers
Arinan Aggarwal 5 years, 5 months ago
Posted by Ansit Kumar 5 years, 6 months ago
- 0 answers
Posted by Ajaz Hussain 5 years, 6 months ago
- 1 answers
Meghna Thapar 5 years, 4 months ago
When consumers make choices about the quantity of goods and services to consume, it is presumed that their objective is to maximize total utility. In maximizing total utility, the consumer faces a number of constraints, the most important of which are the consumer's income and the prices of the goods and services that the consumer wishes to consume. The consumer's effort to maximize total utility, subject to these constraints, is referred to as the consumer's problem. The solution to the consumer's problem, which entails decisions about how much the consumer will consume of a number of goods and services, is referred to as consumer equilibrium.
Posted by Ajaz Hussain 5 years, 6 months ago
- 1 answers
Sarita Yadav 5 years, 5 months ago
Posted by Guneet Kaur 5 years, 6 months ago
- 1 answers
Meghna Thapar 5 years, 6 months ago
A budget line shows combinations of two goods a consumer is able to consume, given a budget constraint. An indifference curve shows combinations of two goods that yield equal satisfaction. To maximize utility, a consumer chooses a combination of two goods at which an indifference curve is tangent to the budget line. Budget line is a graphical representation of all possible combinations of two goods which can be purchased with given income and prices, such that the cost of each of these combinations is equal to the money income of the consumer.
Posted by Stanzin Wangchuk 5 years, 6 months ago
- 1 answers
Naitik Katiyar 5 years, 6 months ago
Posted by Naman Anand 5 years, 6 months ago
- 0 answers
Posted by Sakshi Pokhriyal 5 years, 6 months ago
- 2 answers
Meghna Thapar 5 years, 6 months ago
Capitalism is an economic system in which private individuals or businesses own capital goods. The production of goods and services is based on supply and demand in the general market—known as a market economy—rather than through central planning—known as a planned economy or command economy. Examples. The United States is one example of capitalism, but it doesn't rank among the 10 countries with the freest markets, according to the Index of Economic Freedom.
Posted by A Dhakshina 5 years, 6 months ago
- 1 answers
Gaurav Seth 5 years, 6 months ago
Assumed Mean Method Formula
Let x1, x2, x3,…,xn are mid-points or class marks of n class intervals and f1, f2, f3, …, fn are the respective frequencies. The formula of the assumed mean method is:
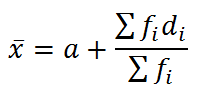
Here,
a = assumed mean
fi = frequency of ith class
di = xi – a = deviation of ith class
Σfi = n = Total number of observations
xi = class mark = (upper class limit + lower class limit)/2
Posted by Ranjita Khatun 5 years, 6 months ago
- 2 answers
Posted by Mahak Mishra 5 years, 6 months ago
- 1 answers
Gaurav Seth 5 years, 6 months ago
PPF which is called Production Possibility Frontier is a curve indicating various possibilities of two goods which can be produced by using available resources and given level of technology. It shows that all the available resources and technology are optimally utilised if a country is producing maximum amount of goods and services. The curve shows that any combination of goods which lie on the production possibility frontier can be achieved if all the resources are fully utilised. Any production combination below the production possibility frontier indicates that the resources are not optimally utilised in the production process.
In the given figure, P1P1 the production possibility curve represents the different combinations between two goods which can be produced in an economy given the resources and technology. However, if there is any growth of resources in the economy it leads to an outward shift in the production possibility curve in the economy. This growth in the resources/technology leads to a shift in the PPC, as given by P2P2 curve.
Posted by Mahak Mishra 5 years, 6 months ago
- 2 answers
Gaurav Seth 5 years, 6 months ago
Production Possibility Curve refers to the graphical representation of possible combinations of two goods that can be produced with given resources and technology.
PPC slopes downwards from left to the right. It is because, in a situation of fuller utilization of given resources, production of both the goods cannot be increased. More of Good X can be produced only with less of Good Y.
Posted by Mahak Mishra 5 years, 6 months ago
- 1 answers
Ashita Kashyap 5 years, 6 months ago
Posted by Mahak Mishra 5 years, 6 months ago
- 1 answers
Gaurav Seth 5 years, 6 months ago
Actual Output can be defined as the growth in the quantity of goods and services produced in a country, or in other words the percentage chance in GDP. While Potential Output is the change in the productive potential of a economy over time.
To put this in simpler terms actual output is growth that has actually happened in real life, while potential output is how much growth the economy could achieve. The difference between actual output and potential output is known simply as the output gap. A positive output gap is when actual GDP is above the productive potential of the economy, while a negative output gap is when actual GDP is below the productive potential of an economy.
Posted by Mahak Mishra 5 years, 6 months ago
- 1 answers
Gaurav Seth 5 years, 6 months ago
In Economical terms, an attainable combination is the set or combination of two goods which is feasible by the economy to manufacture with the available resource allocation and technology.
Unattainable combination is the combination of two goods which is not possible to be produced with allocated resource and available technology.
In a Production Possibility Curve (PPC) that represents the production of two goods, the points that lie on the curve shows the attainable combination (efficient) and those points that lie within the curve also shows attainable combination but it is inefficient production.
Points on the right on outside the curve represents the unattainable combination of goods.
Posted by Arti Kullu 5 years, 6 months ago
- 1 answers
Gaurav Seth 5 years, 6 months ago
| Sr. No. | Marks (X) |
Deviation from the Assumed mean d = X − A where A = 50 |
| 1. 2. 3. 4. 5. 6. 7. 8. 9. 10. 11. 12. 13. 14. 15. |
20 44 65 28 45 67 30 50 (A) 68 39 53 70 40 60 75 |
-30 -06 15 -22 -05 17 -20 0 18 -11 3 20 -10 10 25 |
| N = 15 | ΣX = 754 | Σd = -104 + 108 = 4 |
where,
N= Number of items
ΣX= Total of monthly income of all the families
Σd= net sum of deviations
Calculation of Mean by direct method
X=ΣX/N
X bar =50.27
Posted by Khushi Chopra 5 years, 6 months ago
- 0 answers
Posted by Mahak Mishra 5 years, 6 months ago
- 1 answers
Yogita Ingle 5 years, 6 months ago
Production possibility curve shows all different attainable combinations of the production of two commodities that can be produced in an economy with given the resources and technology which are to be fully utilized.
| Guns (Units) | Bread (Units) | Marginal Opportunity Cost |
| 0 | 30 | −− |
| 1 | 28 | 221=2 |
| 2 | 24 | 441=4 |
| 3 | 18 | 661=6 |
| 4 | 10 | 881=8 |
| 5 | 0 | 10 |
 </div>
</section>
</div>
</section>
Posted by Deepak Jain 5 years, 6 months ago
- 3 answers
Sakshi Pokhriyal 5 years, 6 months ago
Gaganjot Kaur 5 years, 6 months ago
Shreya Kumari 5 years, 6 months ago
Posted by Vaibhav Bajpai 5 years, 6 months ago
- 1 answers
Ritu Sain 5 years, 6 months ago
Posted by Smrita Dutta 5 years, 6 months ago
- 3 answers
Gaganjot Kaur 5 years, 6 months ago
Kavya Kanishka 5 years, 6 months ago
Yogita Ingle 5 years, 6 months ago
The degree of responsiveness of quantity demanded to changes in price of commodity is known as price elasticity of Demand.
Posted by Rohan Thakur 4 years, 10 months ago
- 1 answers
Sia ? 4 years, 10 months ago
Survey Request. The first paragraph of a cover letter serves as an introduction and conveys the key point or purpose of the mailing, that is, requesting that the respondent complete and return the enclosed questionnaire and identifying what organization is conducting the survey and why.
Posted by Rohan Thakur 5 years, 6 months ago
- 1 answers
Yogita Ingle 5 years, 6 months ago
Questionnaire was first developed in London in 1838. This is a method of collecting data from respondents through a series of questions. It focuses more on obtaining standardized answers instead of specific answers. There are 7 different types of Questionnaires.
Schedule is another data collection technique containing statements, questions, and blank spaces to fill up the answers given by the respondents to the enumerator or interviewer.
| Questionnaire | Schedule |
| Questionnaire is one of the methods used for data collection. Questionnaire will have many questions, with each question having multiple choices. | Schedule is also one of the methods of data collection. It will have a set of statements, questions and space given to note down the answers. |
| Questionnaire method of data collection is preferred when the respondents are willing to cooperate. In addition, to deploy this method the respondents need to be literate. | The Schedule method of data collection can be utilised irrespective of the respondents literacy. It can be used when the respondents are literate and can be used even when the respondents are illiterate. |
| The type of technique used in the Questionnaire method is Quantitative. | The type of technique used in the Schedule method is Qualitative. |
| In the Questionnaire method, grouping is made on the basis of different categories like location, age, gender etc. | In the schedule method of data collection, grouping may exist or may not exist. |
| Informants receive questionnaires through mails, posts and the answers will be given as per instructions given in the cover letter. | Answers in the Schedule method of data collection are filled by research workers/enumerators. |
Posted by Khushi Panjwani 5 years, 6 months ago
- 1 answers
Meghna Thapar 5 years, 6 months ago
The basic economic activities of life are production, distribution and disposition of goods and services. A society will be facing scarcity of resources during the time of fulfillment of these activities.
As such scarcity is evident, due to the availability of limited resources, and human needs having no limit. Therefore, this variation between the supply and demand leads to the formation of central problems of an economy.
The central problems of an economy revolve around these factors.
- What to produce?
- How to produce?
- For whom to produce?
Posted by Simi Nihas 5 years, 6 months ago
- 0 answers
Posted by Aarti Lohia 5 years, 6 months ago
- 0 answers

myCBSEguide
Trusted by 1 Crore+ Students

Test Generator
Create papers online. It's FREE.
![]()
CUET Mock Tests
75,000+ questions to practice only on myCBSEguide app

Gaurav Seth 5 years, 6 months ago
A bumper harvest is a boon to farmers more than it is a bane.
However in some circumstances it can be either, depending on the market scenarios and the market opportunities.
Explanation:
A boon
A bumper harvest in most instances is a boon or blessing to the farmers.
When farmers have a bumper harvest, they reap more and earn a lot from sales. This however depend on market availability, availabilty of transport and/or availabilty of storage faciities.
If the farmers' products hit the market in a timely manner, they are more likely to get more returns and it becomes a success story.
A bane
Imagine if all the farmers planting the same crop as you did had a bumper harvest, this would mean that you not are the only person with plenty.
The only way you would be able to a get a good deal from the market is if your products hit the the market first or early enough.
At times, many farmers don't plan well and their bumper harvest end up as loss due to lack of storage and/or transportation facilities.
However, in the long run, most of the time, the bumper harvest end as a blessing to the farmers. Since they are dealing with surplus, the farmers do not really have much to lose.
0Thank You