
Ask questions which are clear, concise and easy to understand.
Ask QuestionPosted by Debanjana Roy Choudhury 6 years, 4 months ago
- 1 answers
Mukul Mittal 6 years, 4 months ago
Posted by Lishi Poul 6 years, 4 months ago
- 2 answers
Nawaz # 6 years, 4 months ago
Tamana Tamana 6 years, 4 months ago
Posted by Anshal Krishna 6 years, 4 months ago
- 3 answers
Sia ? 6 years, 4 months ago
Price elasticity of demand is an economic measure of the change in the quantity demanded or purchased of a product in relation to its price change.
| Price (Rs.) |
Total Expenditure (Rs.) | Quantity Demanded (units) |
| 4 | 200 | {tex}\frac{200}{4}=50{/tex} |
| 3 | 300 | {tex}\frac{300}{3}=100{/tex} |
| Change in Price | Percentage Change in Price | Change in Demand | Percentage change in Demand |
| Rs.4 to Rs.3 | {tex}{\frac{3-4}{4} \times 100}{/tex} = -25 per cent |
50 units to 100 units | {tex}\frac{100-50}{50} \times 100{/tex} = 100 percent |
Price elasticity of demand (Ed)
{tex}=\frac{(-) \% \text { Change in quantity demanded }}{\% \text { Change in price }}{/tex},
{tex}=(-) \frac{100}{-25}=4{/tex},
Elasticity of demand is greater than unity.
Posted by Riya Bhadra 6 years, 4 months ago
- 1 answers
Sia ? 6 years, 4 months ago
'Loss of information' is a major drawback of the classified data. The classification or grouping of raw data into classes makes it more concise and understandable. But simultaneously there exists loss of information. The calculations involved in the classified data or the continuous series are based on the class midpoints. The items in such series cannot be exactly measured and consequently, an individual observation loses its importance during the statistical calculations. Further, the statistical calculations are based on the values of the class marks, ignoring the exact observations of the data leads to the problem of loss of information.
Posted by Teesha Mittal 6 years, 4 months ago
- 0 answers
Posted by Siddhant Jain 6 years, 4 months ago
- 2 answers
Aarush Garg 6 years, 4 months ago
Posted by Ujjwal Thakur 6 years, 4 months ago
- 2 answers
Tamana Tamana 6 years, 4 months ago
Posted by Gurcharn Kaur 6 years, 4 months ago
- 1 answers
Yogita Ingle 6 years, 4 months ago
The functional relationship between physical inputs (or factors of production) and output is called production function. It assumed inputs as the explanatory or independent variable and output as the dependent variable. Mathematically, we may write this as follows:
Q = f (L,K)
Here, ‘Q’ represents the output, whereas ‘L’ and ‘K’ are the inputs, representing labour and capital (such as machinery) respectively.
Posted by Vikram Shukl 6 years, 4 months ago
- 2 answers
Posted by Rohit Nath 6 years, 4 months ago
- 1 answers
Aarush Garg 6 years, 4 months ago
Posted by Sharad Khatri 6 years, 4 months ago
- 1 answers
Sia ? 6 years, 4 months ago
There are two main types of inflation: demand pull and cost push. Fueled by income and strong consumer demand, demand-pull inflation occurs when the economy demands more goods and services than are available.
Posted by Renuka Renuka K 6 years, 4 months ago
- 1 answers
Yogita Ingle 6 years, 4 months ago
Discrete variables—It refers to those variables which are exact or finite and are not expressed in fractions.
Continuous Variable— Are those variables which can be of any partial value within the range.
Posted by Renuka Renuka K 6 years, 4 months ago
- 1 answers
Yogita Ingle 6 years, 4 months ago
Discrete variables—It refers to those variables which are exact or finite and are not expressed in fractions.
Continuous Variable— Are those variables which can be of any partial value within the range.
Posted by Navalpreet Singh 6 years, 4 months ago
- 1 answers
Posted by Jashandeep Singh 6 years, 4 months ago
- 0 answers
Posted by Pari Gupta 6 years, 4 months ago
- 0 answers
Posted by Kamlesh Chander 6 years, 4 months ago
- 0 answers
Posted by Rahul Rao 6 years, 4 months ago
- 0 answers
Posted by Kundan Rastogi 6 years, 4 months ago
- 1 answers
Posted by Yash Sankhe 6 years, 4 months ago
- 0 answers
Posted by Gautam Singh 6 years, 4 months ago
- 1 answers
Posted by Gautam Singh 6 years, 4 months ago
- 1 answers
Barsha Chakraborty 6 years, 4 months ago
Posted by Srishti Jaiswal 6 years, 4 months ago
- 1 answers
Posted by Praduman Paghval 6 years, 4 months ago
- 1 answers
Muskan Varshney 6 years, 4 months ago
Posted by Akansha Jain 6 years, 4 months ago
- 1 answers
Sia ? 6 years, 4 months ago
Price elasticity of supply (PES) measures the responsiveness of quantity supplied to a change in price. It is necessary for a firm to know how quickly, and effectively, it can respond to changing market conditions, especially to price changes.
{tex}\frac{\mathrm{E}_{\mathrm{SA}}}{\mathrm{E}_{\mathrm{SB}}}=\frac{1}{1.5}{/tex}...(i)
ESA {tex}=\frac{\% \text { Change in } Q s \text { of } A}{\% \text { Change in Price of } A}{/tex}
ESA{tex}=\frac{40}{20}{/tex}= 2 Put in eq. (i)
{tex}\frac{2}{\mathrm{E}_{\mathrm{SB}}}=\frac{1}{1.5}{/tex}
2{tex}\times{/tex}1.5 = ESB
3.0 = ESB
ESB{tex}=\frac{\% \text { Change in } Q s \text { of } B}{\% \text { Change in Price of } B}{/tex}
% Change in QSof B{tex}=\frac{(11-10)}{10} \times{/tex}100 = 10%
3{tex}=\frac{\% \text { Change in } Q s \text { of } B}{\% \text { Change in Price of } B}{/tex}
3{tex}=\frac{\% \text { Change in } Q s \text { of } B}{10}{/tex}
30 = % Change in QS of B.
Posted by Suruchi Kumari 6 years, 4 months ago
- 1 answers
Sia ? 6 years, 4 months ago
According to the indifference curve analysis, consumer's equilibrium is at a point where the slope of the indifference curve is equal to the slope of the budget line or the price line.
The conditions of the consumer's equilibrium are
- The given price line should be tangent to an indifference curve or marginal rate of satisfaction of good X for good Y (MRSxy) must be equal to the price ratio of the two goods. i.e.{tex}\operatorname { MRS } _ { x y } = \frac { P _ { x } } { P _ { y } }{/tex}, where
MRSxy = Marginal Rate of Substitution of good X and good Y
Px = Price of good X
Py = Price of good Y, and - At the point of equilibrium, the indifference curve must be convex to the origin. It implies that at the point of equilibrium, MRS must be diminishing.
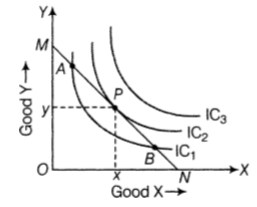
In the diagram given, P is the equilibrium point at which budget line touches the Indifference Curve IC2. - The consumer’s consumption decision is explained by combining the budget line and the indifference map

myCBSEguide
Trusted by 1 Crore+ Students

Test Generator
Create papers online. It's FREE.
![]()
CUET Mock Tests
75,000+ questions to practice only on myCBSEguide app

Harsh Khandelia 6 years, 4 months ago
1Thank You