
Ask questions which are clear, concise and easy to understand.
Ask QuestionPosted by Anushka Rao 5 years, 4 months ago
- 0 answers
Posted by ?? 5 years, 4 months ago
- 2 answers
Gaurav Seth 5 years, 4 months ago
Factors of production (labour and capital) are always jointly used: Labour is combined with capital (say plant, machinery etc). In India, there is severe shortage of capital. In the absence of capital, labour cannot be used. Hence, there is huge unemployment of labour although scarcity of resources is a universal fact.
Posted by Lakhan Ahirwar 5 years, 4 months ago
- 2 answers
Yogita Ingle 5 years, 4 months ago
Microeconomics is a branch of Economics that contemplate the attributes of decision makers within the economy, such as households, individuals and enterprises. The term ‘firm’ is generally used to refer to all sorts of business activities. Microeconomics differ from the study of Macroeconomics, which considers the economy as an entity.

Posted by ?? 5 years, 4 months ago
- 5 answers
Posted by Saloni ? 5 years, 4 months ago
- 1 answers
Yogita Ingle 5 years, 4 months ago
PPC is concave to the origin because of increasing Marginal opportunity cost. This is because inorder to increase the production of one good by 1 unit more and more units of the other good have to be sacriced since the resources are limited and are not equally efficient in the production of both the goods.
Posted by Taposhei Kalita 5 years, 4 months ago
- 1 answers

Posted by Bankhlainbor Sun 5 years, 4 months ago
- 0 answers
Posted by Yash Tandon 5 years, 4 months ago
- 1 answers
Gaurav Seth 5 years, 4 months ago
1. A tabulation is a scientific process involving the presentation of classified data in an ordely man-ner so as to bring out their essential features and chief characteristics.
2.
When data is classified according to measurable characteristics such as height and weight it is quantitative classification of data.
Quantitative data are expressed in terms of number. For example, classification of data based on the height of students in a class.
<button aria-label="like this post" title="like this post"></button>
Posted by Dhruv .. 5 years, 4 months ago
- 1 answers
Yogita Ingle 5 years, 4 months ago
Marginal utility refers to additional utility obtained from the consumption of an additional unit of a commodity. To illustrate, if 10th unit yields satisfaction of 100 utils, while 11th unit yields satisfaction of 105 utils, then marginal utility derived from the 11 th unit is 5 utils.
Law of diminishing marginal utility states that as consumption increases, marginal utility tends to decline. It is known as fundamental psychological law.
Posted by Gauri Dua 5 years, 4 months ago
- 1 answers
Posted by Baresh Ali 5 years, 4 months ago
- 0 answers
Posted by Baresh Ali 5 years, 4 months ago
- 0 answers
Posted by ꪊꪑꪖꪀᧁ ΡꪖTꫀꪶ 5 years, 4 months ago
- 2 answers
Yogita Ingle 5 years, 4 months ago
By distrust of statistics, we mean lack of confidence in statistical statements and statistical methods. In other words, distrust of statistics implies that people look upon statistics with doubt and suspicion.
Following are some remarks :
1. Statistics can prove or disprove anything.
2. There are three types of lies : lies, damned lies and statistics.
Following are the main reasons for distrust of statistics :
(i) Figures are manipulated by dishonest persons to present a wrong picture of the facts.
(ii) People do not really know about statistics.
Posted by Udita Das 5 years, 4 months ago
- 1 answers
Yogita Ingle 5 years, 4 months ago
An empirical relation exists in between mean, median and mode which is
Mode = 3(Median) − 2(Mean)
Posted by Vikas Kumar 5 years, 5 months ago
- 2 answers
Yogita Ingle 5 years, 5 months ago
When consumer consumes two commodities, then equilibrium is achieved when consumer equates the ratio of marginal utility derived from one commodity in comparison to it's price with the ratio of the marginal utility of another commodity in comparison to it's price which states that consumer is rational in consumption of both the commodities.
Posted by Saloni ? 5 years, 5 months ago
- 2 answers
Akshat Jaiswal 5 years, 4 months ago
Yogita Ingle 5 years, 5 months ago
Scarcity: Refers to limited supply of resources in the economy in relation to demand, this is due to the unlimited wants of human beings.
Posted by Ibakmen Synrem 5 years, 5 months ago
- 1 answers
Meghna Thapar 5 years, 5 months ago
An indifference curve is a graph showing combination of two goods that give the consumer equal satisfaction and utility. Each point on an indifference curve indicates that a consumer is indifferent between the two and all points give him the same utility. The theory of indifference curves was developed by Francis Ysidro Edgeworth, who explained in his 1881 book the mathematics needed for their drawing; later on, Vilfredo Pareto was the first author to actually draw these curves, in his 1906 book. An indifference curve is a graphical representation of a combined products that gives similar kind of satisfaction to a consumer thereby making them indifferent. Every point on the indifference curve shows that an individual or a consumer is indifferent between the two products as it gives him the same kind of utility.
Posted by Harsh Dada Kashyap 5 years, 5 months ago
- 1 answers
Gaurav Seth 5 years, 5 months ago
| Questionnaire | Schedule |
| The questionnaire is one of the methods used for data collection. The questionnaire will have many questions, with each question having multiple choices. | The schedule is also one of the methods of data collection. It will have a set of statements, questions and space given to note down the answers. |
| Questionnaire method of data collection is preferred when the respondents are willing to cooperate. In addition, to deploy this method the respondents need to be literate. | The Schedule method of data collection can be utilised irrespective of the respondent’s literacy. It can be used when the respondents are literate and can be used even when the respondents are illiterate. |
| The type of technique used in the Questionnaire method is Quantitative. | The type of technique used in the Schedule method is Qualitative. |
| In the Questionnaire method, the grouping is made on the basis of different categories like location, age, gender etc. | In the schedule method of data collection, the grouping may exist or may not exist. |
| Informants receive questionnaires through emails, posts and the answers will be given as per instructions given in the cover letter. | Answers in the Schedule method of data collection are filled by research workers/enumerators. |
| In the Questionnaire method, there is no scope for direct personal contact with the respondents. | In the Schedule method, there is direct personal contact of the respondents with the enumerators. |
| The cost incurred in the questionnaire method of data collection is economical in comparison with the schedule. The cost is less even if the sample size used is very large. Predominantly the money is spent on preparing questionnaires only. | The cost incurred in the Schedule method of data collection is very expensive since there is the cost involved in preparing the schedule, cost incurred on enumerators in addition to the training imparted to them. |
| The coverage of Questionnaire method is large as the questionnaires can even be sent to respondents who are not easily accessible. | The coverage of this method is relatively small as there are constraints in sending enumerators to larger areas. |
Posted by Naina Rathi 5 years, 5 months ago
- 1 answers
Harsh Dada Kashyap 5 years, 5 months ago
Posted by Naina Rathi 5 years, 5 months ago
- 1 answers
Gaurav Seth 5 years, 5 months ago
|
Basis of difference |
Census method |
Sample method |
|
1. Items to be studied |
1. Under census method each and every unit of the universe is studied. |
1. Under sample method, only some of the items which represent the population are studied. |
|
2. Suitability |
2. This method is suitable when the area of investigation is relatively small. |
2. This method is suitable where the area of investigation is wide. |
|
3. Conclusion |
3. In this method, conclusions are drawn on the basis of whole universe. |
3. In this method, conclusions are drawn on the basis of a sample. |
|
4. Time |
4. It is more time consuming method. |
4. It is less time consuming method. |
|
5. Natural of items |
5. Census method is particularly suitable where the items in the population have diverse characteristics. |
5. Sampling method is particularly suitable when items in the population are homogeneous. |
|
6. Verification |
6. Under census method the results of investigation is generally not possible. |
6. Under sampling method results can be verified by taking out another sample. |
|
7. Nature of method |
7. It is an old method of investigation. |
7. It is a new and practicable method. |
|
8. Number of enumerators |
8. Census method requires a large number of enumerators. |
8. It does not require a large number of e- umerators. |
|
9. Expensive |
9. It is more expensive. |
9. It is c'r lparatively less expensive' |
Posted by Naina Rathi 5 years, 5 months ago
- 2 answers
Gaurav Seth 5 years, 5 months ago
In statistics, quality assurance, and survey methodology, sampling is the selection of a subset of individuals from within a statistical population to estimate characteristics of the whole population. Statisticians attempt for the samples to represent the population in question.
Posted by Naina Rathi 5 years, 5 months ago
- 1 answers
Yogita Ingle 5 years, 5 months ago
Census of India: Ir is responsible for the collection of data related to different demographic characteristics. Data is collected for characteristics such as birth rate, fertility rate, mortality rate, size and composition of the population etc. The information related to all aspects of the population are collected by the investigators appointed by the government. They collect information from each and every household of the country. In India, this exercise is carried after every 10 years. The data collected by the Census of India acts as a mirror for assessing the impact of various programmes and development policies initiated by the government. It also helps in identifying the improvement areas and making the future policy. The first census was conducted in the year 1872 in India and next in 1881.
Posted by Naina Rathi 5 years, 5 months ago
- 0 answers
Posted by Anushka Rao 5 years, 5 months ago
- 2 answers
Gaurav Seth 5 years, 5 months ago
In the process, paper slips are made for 25 students according to there names. The slip's are shuffled in a box. Then, impartially 5 slip's are drawn to form a sample of universe.
Posted by Saloni Kashyap ? 5 years, 5 months ago
- 1 answers
Yogita Ingle 5 years, 5 months ago
Total utility is the overall satisfaction a consumer derives from the consumption of particular goods and services. Each individual unit of goods or services has a marginal utility of their own.
Total utility is the sum of marginal utilities of all such individual items.
Posted by Madhu Prajapat 5 years, 5 months ago
- 1 answers
Yogita Ingle 5 years, 5 months ago
Random sampling refers to the method in which each of the sampling unit (units in the population) has a non-zero probability of being selected into the sample. Simple random sampling is a special case of random sampling when each of the sampling unit has equal chance of being selected.
Non random sampling is a method of sampling wherein, it is not known that which individual from the population will be selected as a sample.
Posted by Madhu Prajapat 5 years, 5 months ago
- 1 answers
Gaurav Seth 5 years, 5 months ago
| Sr.No. | Census Method (survey) | Sr.No. | Sample Method |
| (1) | In census survey, information is collected from each and every unit of the population. | (1) | In sample survey, information is collected from a few selected unit of the population. |
| (2) | It is very expensive and time-consuming. | (2) | It is less expensive and less time-consuming. |
| (3) | It is suitable where the field of investigation is small. | (3) | It is suitable where the field of investigation is large. |
| (4) | It is more accurate and reliable. | (4) | It is less accurate and less reliable. |
| (5) | It rules out the possibility of any personal biases. | (5) | It holds the chance of personal biases in the selection of samples. |
Posted by Ansh Pandey 5 years, 5 months ago
- 0 answers
Posted by Anshul Soni 5 years, 5 months ago
- 1 answers
Gaurav Seth 5 years, 5 months ago
The Law of Demand states that other things remaining constant, the quantity demanded of a commodity expands with fall in its price and contracts with a rise in its price.
So, there is an inverse relationship between price and quantity demanded of a commodity. This is explained with the help of an imaginary table and the curve which is based on imaginary data:
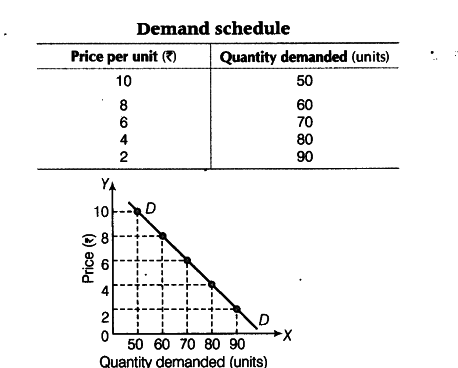
Exceptions to the Law The law will not hold good under following circumstances:
(i) Conspicuous consumption The Law of Demand will not apply in case of costly items such as diamonds. These commodities will be demanded, even if the prices have gone very high.
(ii) Conspicuous necessities Certain things become the necessity of modern life, so we have to purchase these goods inspite of their price. The demand of television sets and automobiles has not gone down inspite of the increase in their price.
(iii) Ignorance If the consumer is not aware of the competitive price of the commodity, he may purchase more of the commodity even at higher price. Such ignorance of the buyers makes the Law of Demand ineffective.

myCBSEguide
Trusted by 1 Crore+ Students

Test Generator
Create papers online. It's FREE.
![]()
CUET Mock Tests
75,000+ questions to practice only on myCBSEguide app

Yogita Ingle 5 years, 4 months ago
Consumer equilibrium is the state when the consumer balances his income and his purchase value.
The consumer reacts proud of himself when he made a perfect balance between his expense and the expenditure.
This equilibrium will be made when the income remains somewhat after spending for purchasing all the goods.
1Thank You