
Ask questions which are clear, concise and easy to understand.
Ask QuestionPosted by Anurag Shivam 5 years, 4 months ago
- 1 answers
Posted by Shourya Yadav 5 years, 4 months ago
- 0 answers
Posted by Kavya Reddy 5 years, 4 months ago
- 1 answers
Yogita Ingle 5 years, 4 months ago
A sub-divided or component bar chart is used to represent data in which the total magnitude is divided into different or components. In this diagram, first we make simple bars for each class taking the total magnitude in that class and then divide these simple bars into parts in the ratio of various components.
Posted by Simran Vishwakarma 5 years, 4 months ago
- 1 answers
Gaurav Seth 5 years, 4 months ago
Perfectly inelastic demand implies that there is no change in quantity demanded with a change in the prices of that good. This is shown on a graph by a straight line parallel to 'Y' axis. In case of perfectly inelastic demand the curve is a vertical straight line parallel to 'OY' axis. This is because the change in price of the product or service has no impact on the quantity demanded as the elasticity is equal to zero.
Posted by Lal Muanpuii 5 years, 4 months ago
- 1 answers
Meghna Thapar 5 years, 4 months ago
In a pie chart, the various observations or components are represented by the sectors of a circle and the whole circle represents the sum of the value of all the components . Clearly, the total angle of 360° at the center of the circle is divided according to the values of the components. A bar graph is a chart that uses bars to show comparisons between categories of data. The bars can be either horizontal or vertical. Bar graphs with vertical bars are sometimes called vertical bar graphs. Pie charts are generally used to show percentage or proportional data and usually the percentage represented by each category is provided next to the corresponding slice of pie.
Posted by Unnati Singh Parihar 5 years, 4 months ago
- 2 answers
Aaditya Singh 5 years, 4 months ago
Gaurav Seth 5 years, 4 months ago
It is given that, the demand for a commodity increases from 100 units to 200 units when the price of that commodity decreases from 12 to 10 Rs.
We have to find the Elasticity of Demand.
The percentage change in price = (change in price / original price ) X 100
= (2 / 12) X 100
= 16.67%
The percentage change in quantity = (change in quantity / original quantity ) X 100
= (100 / 100 ) X 100
= 100%
The elasticity of demand = % change in quantity / % change in price
= 100 / 16.67
= 5.99
The elasticity of demand is 5.99.
The elasticity of demand comes after dividing the percentage change in quantity with the percentage change in price. Thus, the elasticity of demand is 5.99.
Posted by Shivangi Singh 5 years, 4 months ago
- 0 answers
Posted by Naira(奈拉)..... ?️⚡?️⚡ ??? 5 years, 4 months ago
- 1 answers
Yogita Ingle 5 years, 4 months ago
| Extension of Supply | Contraction of Supply |
| (a) When the supply of a commodity rises only due to increase in the price of the commodity, then it is said to be extension in supply. | (a) When supply of a commodity falls only due to fall in the price of that commodity it is said to be contraction of supply. |
| (b) Extension in supply is shown by an upward movement to right on the same supply curve. | (b) Contraction is shown by the downward movement to left on the same supply curve. |
Posted by Himanshu Pundir 5 years, 4 months ago
- 1 answers
Meghna Thapar 5 years, 4 months ago
The arithmetic mean is calculated by adding up all the values and dividing the sum by the total number of values. For example, the mean of 7, 4, 5 and 8 is 7+4+5+84=6. Sum of all of the numbers of a group, when divided by the number of items in that list is known as the Arithmetic Mean or Mean of the group. For example, the mean of the numbers 5, 7, 9 is 4 since 5 + 7 + 9 = 21 and 21 divided by 3 [there are three numbers] is 7.
Posted by Rajesh Kumar 5 years, 4 months ago
- 2 answers
Janvi Jangra 5 years, 4 months ago
Gaurav Seth 5 years, 4 months ago
Answer : Demand curve in upward sloping for Giffen goods
Explanation:
Slope of the demand curve for Giffen goods is upward sloping, indicating a positive relationship between price and quantity demanded of a commodity.
Posted by Fepi Tachang 5 years, 4 months ago
- 2 answers
Yogita Ingle 5 years, 4 months ago
| Sr.No. | Census Method (survey) | Sr.No. | Sample Method |
| (1) | In census survey, information is collected from each and every unit of the population. | (1) | In sample survey, information is collected from a few selected unit of the population. |
| (2) | It is very expensive and time-consuming. | (2) | It is less expensive and less time-consuming. |
| (3) | It is suitable where the field of investigation is small. | (3) | It is suitable where the field of investigation is large. |
| (4) | It is more accurate and reliable. | (4) | It is less accurate and less reliable. |
| (5) | It rules out the possibility of any personal biases. | (5) | It holds the chance of personal biases in the selection of samples. |
Posted by Ferdyson Shangdiar 4 years, 7 months ago
- 0 answers
Posted by Divyanka Arya 5 years, 4 months ago
- 1 answers
Yogita Ingle 5 years, 4 months ago
Statistics is widely used in modern times. Initially it was employed by the state to collect information in public affairs but it was not used in different spheres of man’s life. Now a days, statistics is used by workers, labour unions, traders, insurance companies, auditors, business men, politicians etc. This is clear from following facts:
(i) Useful to politicians : The politicians and their supporters are immensely interested in knowing their prospects of winning election by sampling few voters prior to elections, the percentage of vote the candidate will receive in the election and results can be worked out.
(ii) Useful to economists: Statistics serves as a raw material to the economists in making certain economic laws.
(iii) Useful to finance minister: For making sound and balanced annual budget of the country, statistics plays a very important role. He too takes the help of accurate and reliable data regarding the state of affairs which is provided by statistics.
(iv) Useful to bankers : Statistics is very useful for bankers and banking industry. Every bank has a statistical department that helps to make its own policy.
(v) Useful to an individual : Statistics is very useful for an individual. It provides him factual knowledge of prices of commodities in different markets. He also comes to know about the national products of social, political and economic conditions.
(vi) Useful to businessmen : It is necessary for an efficient businessmen to have the full knowledge of the factors which influence his
business decisions.
 </a>
??
</a>
??Posted by Dhruv .. 5 years, 4 months ago
- 2 answers
Kirti Singh 5 years, 4 months ago
Kehar Pundir Pundir 5 years, 4 months ago
Posted by Soumya Sharma 5 years, 4 months ago
- 0 answers
Posted by Arjun Choudhary 5 years, 4 months ago
- 0 answers
Posted by Boss Is Back 5 years, 4 months ago
- 1 answers
Gaurav Seth 5 years, 4 months ago
- Quantitative expression of economic problems: Statistics is an essential tool for an economist to understand the problems of an economy through quantitative data. Example: The problem of poverty in India can be quantitatively expressed as there is a substantial decline in poverty ratios in India from 55% in 1973to 36% in1993.
- Inter-sectoral and inter-temporal comparisons: This quantitative data is further used to make inter-sectoral comparison ,i.e. across different sectors of the economy and inter-temporal comparisons ,i.e. over different plan periods of the rural and urban unemployment.
- Cause and effect relationship: Different sets of data are used to find the cause and effect relationship. This enables policy makers to formulate policy to solve the problem of an economy.
- Economic equilibrium: Statistical data helps economists to understand the behaviour of the producer and consumer in the market. Example: How the producer choose sthe combination of inputs to produce the goods to maximise their profit.
- Developing economic theories: This also facilitates economists to develop theories as how the prices of goods vary in relation to the demand for the product.
- Forecasting: Statistical data are useful to forecast the changes in the factors which influence other factors. This information enables economists to formulate polices and suggestions to overcome the problem.
- Formulation of policies: Statistical data is essential for formulating policies of economic development. Example: If the government wants to formulate or modify labour laws, then it will require statistical data on working conditions, number of working hours and minimum wages received by workers.
Posted by Himanshi Saini 5 years, 4 months ago
- 1 answers
Gaurav Seth 5 years, 4 months ago
| Basis of Comparison | Discrete Variable | Continuous Variable |
| Meaning | A variable with a limited number of values which are isolated | Is characterized by variables with unlimited number of ranging values |
| Values | Countable | Measurable |
| Range of specified number | Complete or whole | Incomplete |
| Represented by | Lone points on a graph | Linked points |
| Classification | Do not overlap | Overlapping |
| Assumes | Separate or distinct value | A value between a range |
Posted by Lalhmangaihzuali Zuali 5 years, 4 months ago
- 1 answers
Yogita Ingle 5 years, 4 months ago
Data is the information in the inexperienced or disordered information such as letters, symbols, or numbers that apply to, or picture, positions, opinions, or objects. Primary, or "statistical" are the kind of data that are managed essentially for producing official statistics and introduce analytical surveys and statistics. Statistical specialists relate to data that are managed for some certain expectations and include statistics and officially transferred reviews. Non-statistical references refer to the data that are obtained for other regulatory expectations or the individual sector.
Posted by Khushi Chandnawat 5 years, 4 months ago
- 0 answers
Posted by Zigmey Sonam 5 years, 4 months ago
- 0 answers
Posted by Priya Yadav 5 years, 4 months ago
- 1 answers
Gaurav Seth 5 years, 4 months ago
Consumer equilibrium refers to a situation, in which a consumer derives maximum satisfaction, with no intention to change it and subject to given prices and his given income. The point of maximum satisfaction is achieved by studying indifference map and budget line together. On an indifference map, higher indifference curve represents a higher level of satisfaction than any lower indifference curve. So, a consumer always tries to remain at the highest possible indifference curve, subject to his budget constraint.
Conditions of Consumer’s Equilibrium:
The consumer’s equilibrium under the indifference curve theory must meet the following two conditions:
(i) MRSXY = Ratio of prices or PX/PY:
Let the two goods be X and Y. The first condition for consumer’s equilibrium is that
MRSXY = PX/PY
(a) If MRSXY > PX/PY, it means that the consumer is willing to pay more for X than the price prevailing in the market. As a result, the consumer buys more of X. As a result, MRS falls till it becomes equal to the ratio of prices and the equilibrium is established.
(b). If MRSXY < PX/PY, it means that the consumer is willing to pay less for X than the price prevailing in the market. It induces the consumer to buys less of X and more of Y. As a result, MRS rises till it becomes equal to the ratio of prices and the equilibrium is established.
(ii) MRS continuously falls:
The second condition for consumer’s equilibrium is that MRS must be diminishing at the point of equilibrium, i.e. the indifference curve must be convex to the origin at the point of equilibrium. Unless MRS continuously falls, the equilibrium cannot be established.
Thus, both the conditions need to be fulfilled for a consumer to be in equilibrium.
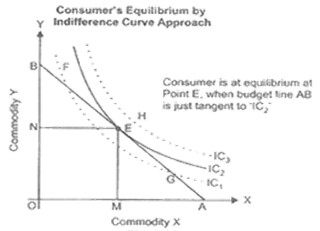
In Fig, IC1, IC2 and IC3 are the three indifference curves and AB is the budget line. With the constraint of budget line, the highest indifference curve, which a consumer can reach, is IC2. The budget line is tangent to indifference curve IC2 at point ‘E’. This is the point of consumer equilibrium, where the consumer purchases OM quantity of commodity ‘X’ and ON quantity of commodity ‘Y. All other points on the budget line to the left or right of point ‘E’ will lie on lower indifference curves and thus indicate a lower level of satisfaction.
Thus, we can conclude that if the consumer is consuming any bundle other than the optimum one, then he would rearrange his consumption bundle in such a manner that the equality between the MRS and the price ratio is established and he attains the state of equilibrium.
Posted by Muskan Chouhan 5 years, 4 months ago
- 0 answers
Posted by Akanksha Tripathi 5 years, 4 months ago
- 1 answers
Gaurav Seth 5 years, 4 months ago
| Change in Supply |
Change in Quantity Supplied | |
| Meaning | When supply due to the change in all other variables other than the price of a good (i.e. price of the good remains same), then it is referred as change in supply. | When supply changes due to change in the price of goods only, assuming other determinants remaining unchanged, then it is referred as change in quantity supplied. |
| Functions | It is represented as Qx=f(Pˉx,Py,Pi,T,G,GF,NF) |
It is represented as Qx=f(Px,Pˉy,Tˉ,Pˉi,Gˉ,Gˉf,NˉF) |
| Shifts & Movements | It results in a shift in the supply curve of the firm which can be rightwards or leftwards. | It results in a movement of the supply curve of the firm which can be upward or downward. |
| Types: | The following are its types: 1) Increase in Supply 2) Decrease in Supply |
The following are its types: 1) Expansion of Supply 2) Contraction of Supply |
Posted by Aliya Aliya 5 years, 4 months ago
- 1 answers
Meghna Thapar 5 years, 4 months ago
Sustainable development is a way for people to use resources without the resources running out. ... The term used by the Brundtland Commission defined it as development with sustainability that "meets the needs of the present and also compromising the ability of future generations to meet their own needs." Sustainable development is the idea that human societies must live and meet their needs without compromising the ability of future generations to meet their own needs. ... Specifically, sustainable development is a way of organizing society so that it can exist in the long term.

myCBSEguide
Trusted by 1 Crore+ Students

Test Generator
Create papers online. It's FREE.
![]()
CUET Mock Tests
75,000+ questions to practice only on myCBSEguide app

Yogita Ingle 5 years, 4 months ago
Production Possibility Frontier (PPF) or Production Possibility Curve is the curve which shows the combinations of two goods and services that can be produced with fuller utilisation of a given amount of resources in the most efficient way and with a given production technology.
0Thank You