CBSE class 12 Producer behaviour and Supply files class 12 Notes Economics in PDF are available for free download in myCBSEguide mobile app. The best app for CBSE students now provides accounting for partnership firm’s fundamentals class 12 Notes latest chapter wise notes for quick preparation of CBSE board exams and school based annual examinations. Class 12 Economics notes on chapter 3 accounting for partnership firm’s fundamentals are also available for download in CBSE Guide website.
CBSE Guide Producer behaviour and Supply files class 12 Notes Economics
CBSE guide notes are the comprehensive notes which covers the latest syllabus of CBSE and NCERT. It includes all the topics given in NCERT class 12 Economics text book. Users can download CBSE guide quick revision notes from myCBSEguide mobile app and my CBSE guide website.
12 Economics notes Chapter 3 Producer behaviour and Supply files
Download CBSE class 12th revision notes for chapter 3 Producer behaviour and Supply files in PDF format for free. Download revision notes for Producer behaviour and Supply files class 12 Notes and score high in exams. These are the Producer behaviour and Supply files class 12 Notes prepared by team of expert teachers. The revision notes help you revise the whole chapter 3 in minutes. Revision notes in exam days is one of the best tips recommended by teachers during exam days.
Download Revision Notes as PDF
CBSE Class–12 economics
Revision Notes
Micro Econopmics 03
Producer behaviour and Supply files class 12 Notes Economics
- Production Function : It shows the functional relation between physical inputs and physical output of a good. It can be expressed as Q = (f1, f2, f3……… fn).
Where Q = Physical output of a good; f1, f2, f3, …….fn= Physical inputs.
- Production is creation of utility.
- Types of Production Function :There are two types of Production Function.
1. Short-run Production Function : In this production function one factor of production is variable and all others are fixed. So, law of return to a factor is applied. It is also called variable proportion type of production function.
It is a time period which is not enough to make change in all inputs. In this level of production can be changed by changing the variable factors.2. Long-run Production Function: In this production function all the factors of production are variable. So, law of returns to scale is applied. It is also called constant proportion type of production function.
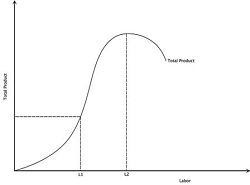
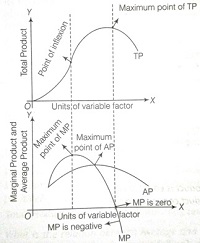
It is a time period which is enough to make change in all inputs, all inputs are variable in the long run. In this level of production can be changed by changing all inputs. - Total product or Total physical product refers to total quantity of a goods and services produced by a firm in a given period of time.
- TP =
MP
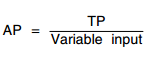
- Average production is the per unit production of variable factor.
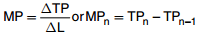
- Marginal product refers to the change in total product resulting from the employment of an additional unit of variable factor. In other words, it is the contribution of each additional unit of variable factor to output.
- Relation between Total, Average and Marginal Product
- 1. When TP increases at an increasing rate, MP also increases.2. When TP increases at a diminishing rate, MP declines.3. When TP is maximum,MP=0.
4. When TP begins to decline, MP becomes negative.
| Labour | MP | TP | AP |
| 1 | 2 | 2 | 2 |
| 2 | 3 | 5 | 2.5 |
| 3 | 4 | 9 | 3 |
| 4 | 3 | 12 | 3 |
| 5 | 1 | 13 | 2.6 |
| 6 | 0 | 13 | 2.16 |
| 7 | -2 | 11 | 1.6 |
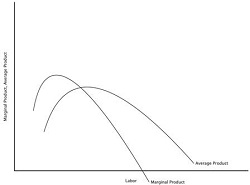
- When MP > AP, AP rises.
- When MP = AP, AP is maximum and constant.
- When MP < AP, AP falls.
- MP may be zero or negative, but AP continues to be positive.
- AP increases, even when MP falls but MP should lie above AP.
- Returns to a factor : It refers to the behaviour of output when only one variable factor of production in increased in short run and fixed factors remain constant.
- Law of variable proportion : The law states that when more and more units of variable factors are employed to increase the output, initially output increases at an increasing rate and finally falls.
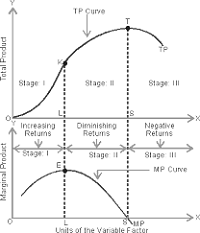
- Stage I (Stage of Increasing Return to factor): TP Increases at increasing rate : In the initial phase as more and more units of variable factors are employed with fixed factor total physical production increases at increasing rate, MP increases.
- Cause for increasing return: (a) Under utilisation of fixed factor (b) Indivisibility of factor (c) Increased efficiency of variable factor
- Stage II(Stage of Diminishing Return to factor) : TP increases at decreasing rate :As more and more units of variable factors are employed with fixed factors then total product increases at diminishing rate, MP decreases but is positive. At the end of this phase TP maximum and MP becomes zero.
- Cause of diminishing return: (a) optimal use of fixed factor (b) imperfect factor substitutability
- Stage III(Stage of negative return to factor) : TP falls :As more and more units of variable factors are employed with fixed factors, total production starts decreasing and marginal product becomes negative.
- Cause of negative return: (a) Poor co-ordination between fixed factor and variable factor. (b) Over utilisation of fixed factor
- Economic Cost : It is the sum total of explicit and implicit cost.
- Explicit Cost : Actual money expenditure incurred by a firm on the purchase and hiring the factor inputs for the production is called explicit cost. These are entered into books of accounts. For example-payment of wages, rent, interest, purchases of raw materials etc.
- Implicit cost is the cost of self owned resources of the production used in production process. Or estimated value of inputs supplied by owner itself. These are not entered into books of accounts.
- Normal Profit : It is the minimum amount required to keep the producers into business. In other words, it is the minimum supply price of the entrepreneur. It is also called the wage off an entrepreneur.
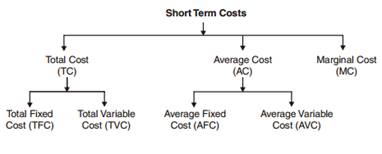
- Total cost refers to total amount of money which is incurred by a firm on production of a given amount of a commodity.
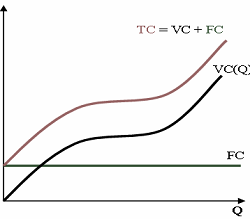
- Total cost is the sum of total fixed cost and total variable cost.TC = TFC + TVC or TC = AC × Q
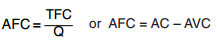
- Total fixed cost:- It is also called supplementary cost. It is the total expenditure incurred by the producer for employing fixed inputs. Ex- Rent of land and building, interest on capital,license fee etc.TFC = TC – TVC or TFC = AFC × Q
- Features of Total Fixed Cost:- (a) It remains constant at all levels of output. It is not zero even at zero output level. Therefore, TFC curve is parallel to X-axis. (b) Total cost at zero level of output is equal to total fixed cost.
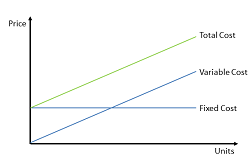
- Total variable cost is the cost which vary with the quantity of output produced. It is zero at zero level of output. TVC curve is parallel to TC curve.Ex-cost of raw material,expenses on power etc.TVC = TC – TFC or TVC = AVC × Q
- Features of Total variable cost:- (a) It is zero when output is zero. (b) It increases with increase in output. (c) Initially TVC increases at diminishing rate due to increasing returns and later it increases at an increasing rate due to diminishing return.
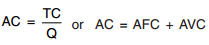
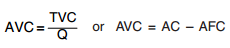
- Average cost is per unit cost of production of a commodity. It is the sum of average fixed cost and average variable cost.
- Average fixed cost is per unit fixed cost of production of a commodity.
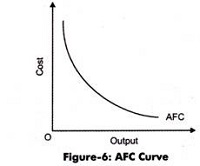
- Features of AFC:- (a) AFC diminishes with increase in output. (b) AFC curve is a rectangular hyperbola.(c) It can not intersect X-axis or Y-axis.
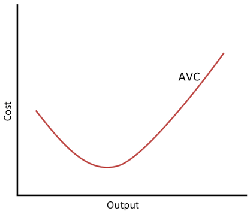
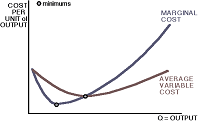
- Average variable cost is per unit variable cost of production of a commodity. AVC is U-shaped due to law of variable proportion.
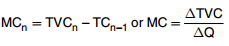
- Marginal Cost – It refers to change in TC, due to additional unit of a commodity is produced. MC = ΔTC/ΔQ or MCn = TCn – TCn–1. But under short run, it is calculated from TVC.
 Relation Between Short-Term Costs
- Total cost curve and total variable cost curve remains parallel to each other. The vertical distance between these two curve is equal to total fixed cost.
- TFC curve remains parallel to X-axis and TVC curve remains parallel to TC curve.
- With increase in level of output, the vertical distance between AFC curve and AC curve goes on increasing. On contrary the vertical distance between AC curve and AVC curve goes on decreasing but these two curves never intersect because average fixed cost is never zero.
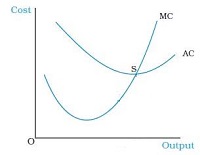
- Relation between MC and AVC.When MC < AVC, AVC falls.When MC = AVC, AVC is minimum and constantWhen MC > AVC, AVC rises. MC curve cuts AVC curve at its lowest point. Both curves are U-shaped and starts from same point.
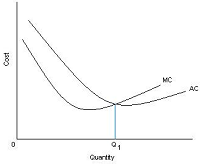
- Relation between MC and AC:- (i) when AC falls, MC < AC. (ii) when AC rises, MC > AC. (iii) when AC is constant and minimum, MC = AC.
- Money received from the sale of product is called revenue.
- Total revenue is the total amount of money received by a firm from the sale of given units of a commodity.
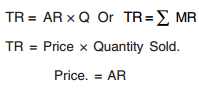
- Per unit revenue received from the sale of given units of a commodity is called average revenue. Average revenue is equal to price. Per unit price of a commodity it also called AR.
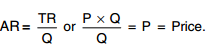
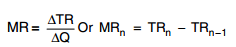
- Marginal revenue is net addition to total revenue when one additional unit of output is sold.
- Relation b/w TR, AR, and MR when more quantity sold at the same price : under perfect competition.(a) Average revenue and marginal revenue remains constant at all levels of output and AR and MR curves are parallel to ox-axis.AR= MR.(b) Total revenue increases at constant rate MR is constant and TR curve is positively sloped straight line passing through the origin.
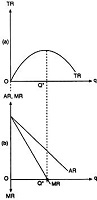
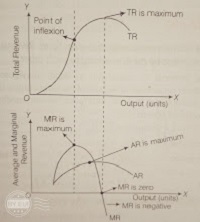
- Relation between TR, AR and MR when more quantity by sold at the lower price or there is monopoly or monopolistic competition in the market.(a) Average revenue and marginal revenue curves have negative slope. MR curve lies below AR curve. AR > MR(b) Marginal revenue falls, twice the rate of average revenue.

(c) So long as marginal revenue decreases and positive, total revenue increases at diminishing rate. When marginal revenue is zero, total revenue is maximum and when marginal revenue becomes negative, TR starts falling.
- Relation b/w AR and MR (General relationship)When MR = AR, AR is maximum and constant. MR can be negative, but not AR.When MR < AR, AR falls. When TR increases at an increasing rate, MR and AR also increases.
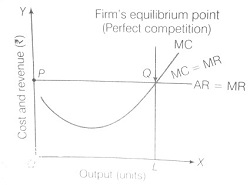
- Concept of Producer’s Equilibrium: If refers the stage where producer is getting maximum profit with given cost and he has no incentive to increase or decrease the level of output.(A) MR and MC Approach: Conditions of producers equilibrium according to this approach are :(a) MC = MR and also AR = MR, hence AR = MR = MC. MC should be rising.(b) MC curve should cut the MR curve from below at the point of equilibrium.
Or
MC should be more than MR after the equilibrium point, with increase in output.
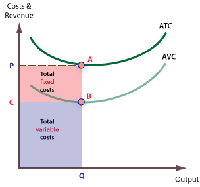
- Normal Profit:- It is a no profit no loss situation, it is achieved when P = AC.It is the minimum return that a producer expects from his capital invested in the business.
- Break-even Point:- It occurs when AR = AC or (TR = TC). At this point, firm is earning zero economic profit or normal profit. OR we can say it is just covering all its costs.
- Shut-down Point:- It occurs when a firm is covering its variable costs only, here, the firm is incurring loss of fixed cost. (TR < TVC OR AR < AVC)
- Supply: Refers to the amount of the commodity that a firm or seller is willing to sell at different prices during a given period of time.
- Factors affecting supply of a commodity:Price of the commodity.Prices of other related goods.Level of Technology.
Prices of inputs.
No. of firms.
Government policy regarding Taxation and subsidies.
Goals of the firm.
- Individual Supply: Refers to quantity of a commodity that an individual firm is willing and able to offer for sale at different price during a given period of time.
- Market supply: It is the sum total of quantity supplied of a commodity by all sellers or all firms in the market at different price and in a given period of time.
- Stock: Refers to the total quantity of a particular commodity available with the firm at a particular point of time.
- Supply Schedule: Refers to a tabular presentation which shows various quantities of a commodity that a producer is willing to supply at different prices, during a given period of time.
- Supply curve: Refers to the graphical representation of supply schedule which represents various quantities of a commodity that a producer is willing to supply at different prices during given period of time.
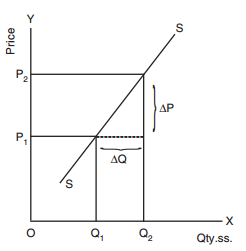
- Slope of supply curve = ΔP/ΔQ. A supply curve has a positive slope.
- Law of Supply: States the direct relationship between price and supply of a commodity, keeping other factors constant. i.e. higher the price, higher the supply and lower the price, lower the supply.
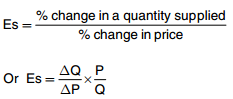
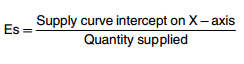
- Price Elasticity of Supply: Refers to the degree of responsiveness of supply of a commodity with reference to a change in price of the commodity. It is always positive due to direct relationship between price and quantity supplied.
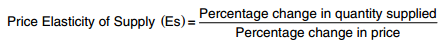
- Methods for measuring price elasticity of supply:1. Percentage Method
 2. Geometric Method
- There are three possibilities of Elasticity of Supply:(a) If a straight line supply curve passes through the point of origin doesn’t matter what it makes angles, Es at any point is equal to unity.(b) If a straight line supply curve passes through left side of point of origin and intersect Y-axis, Es > 1.(c) If a straight line supply curve passes through right side of point of origin and intersect X-axis, Es < 1.
- Change in Q.Supplied Vs change in Supply:a) Change in Q.Supplied or Movement along supply curve(i) Due to change in price of Commodity other factors remain constant
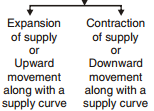
b) Change in Supply or Shift in supply curve
(i) Due to change in factors other than price of the commodity
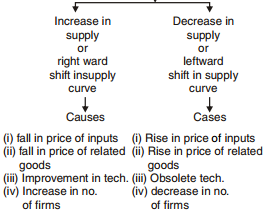
- In simple words, Increase in supply–More supply at the same price or same supply at lower price.
Decrease in supply– Less supply at same price or same supply at a higher price.
Producer behaviour and Supply files class 12 Notes Economics
- CBSE Revision notes (PDF Download) Free
- CBSE Revision notes for Class 12 Economics PDF
- CBSE Revision notes Class 12 Economics – CBSE
- CBSE Revisions notes and Key Points Class 12 Economics
- Summary of the NCERT books all chapters in Economics class 12
- Short notes for CBSE class 12th Economics
- Key notes and chapter summary of Economics class 12
- Quick revision notes for CBSE board exams
CBSE Class-12 Revision Notes and Key Points
Producer behaviour and Supply files class 12 Notes Economics. CBSE quick revision note for class-12 Chemistry Physics Math’s, Economics and other subject are very helpful to revise the whole syllabus during exam days. The revision notes covers all important formulas and concepts given in the chapter. Even if you wish to have an overview of a chapter, quick revision notes are here to do if for you. These notes will certainly save your time during stressful exam days.
- Revision Notes for class-12 Physics
- Revision Notes for class-12 Chemistry
- Revision Notes for class-12 Mathematics
- Revision Notes for class-12 Biology
- Revision Notes for class-12 Accountancy
- Revision Notes for class-12 Economics
- Revision Notes for class-12 Business Studies
- Revision Notes for class-12 Computer Science
- Revision Notes for class-12 Informatics Practices
- Revision Notes for class-12 English Core
- Revision Notes for class-12 History
- Revision Notes for class-12 Physical Education
To download Producer behaviour and Supply files class 12 Notes Economics, sample paper for class 12 Physics, Chemistry, Biology, History, Political Science, Economics, Geography, Computer Science, Home Science, Accountancy, Business Studies and Home Science; do check myCBSEguide app or website. myCBSEguide provides sample papers with solution, test papers for chapter-wise practice, NCERT Producer behaviour and Supply files , NCERT Exemplar Producer behaviour and Supply files , quick revision notes for ready reference, CBSE guess papers and CBSE important question papers. Sample Paper all are made available through the best app for CBSE students and myCBSEguide website.
- Introduction to Micro Economics class 12 Notes Economics
- Consumers Equilibrium & Demand class 12 Notes Economics
- Producer behaviour and Supply files class 12 Notes Economics
- Forms of Market and Price Determination class 12 Notes Economics
- National Income and Related Aggregate class 12 Notes Economics
- Money and Banking class 12 Notes Economics
- Determinations of Income and Employment class 12 Notes Economics
- Government Budget and Economy class 12 Notes Economics
- Balance of Payment class 12 Notes Economics
Test Generator
Create question paper PDF and online tests with your own name & logo in minutes.
Create Now
Learn8 App
Practice unlimited questions for Entrance tests & government job exams at ₹99 only
Install Now