NCERT solutions for Class 9 Maths Statistics Download as PDF
NCERT Solutions for Class 9 Mathematics Statistics
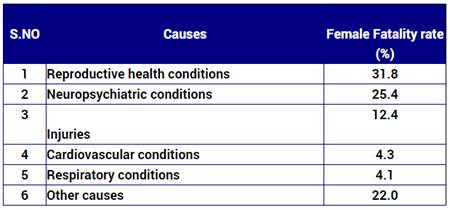
1. A survey conducted by an organization for the cause of illness and death among the women between the ages 15 – 44 (in years) worldwide, found the following figures (in %):
(i) Represent the information given above graphically.
(ii) Which condition is the major cause of women’s ill health and death worldwide?
(iii) Try to find out, with the help of your teacher, any two factors which play a major role in the cause in (ii) above being the major cause.
Ans. (i) We represent the given information in the form of a bargraph. We construct the bar
diagram through the following steps:
Step 1. Draw two perpendicular axes OX and OY on a plain paper.
Step 2. Along OX mark “Causes” and along OY “Female Fertility rate (%)”.
Step 3. Along OX, choose suitable width for each bar.
Step 4. Along OY, choose an appropriate scale and mark the Female Fertility rate (%).
Scale chosen: On y-axis: 1 large division, i.e. 1 cm = 5%
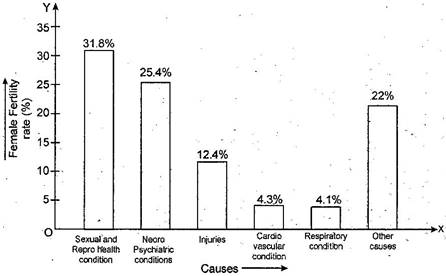
(ii) From the bar graph we observe that sexual and reproductive health condition is the major cause of woman ill health and mortality worldwide.
(iii) Two major factors for poor sexual & reproductive health conditions are as follows:
(a) Lack of awareness among women.
(b) Lack of medical facilities.
2. The following data on the number of girls (to the nearest ten) per thousand boys in different sections of Indian Society is given below:
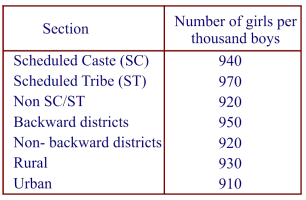
(i) Represent the information above by a bar graph.
(ii) In the classroom discuss what conclusions can be arrived at from the graph.
Ans. (i) We represent the given information in the form of a bar graph. We construct the bar diagram through the following steps:
Step 1. Draw two perpendicular axes OX and OY on a plane paper.
Step 2. Along OX mark “Section” and along OY mark “Number of girls per thousand boys”.
Step 3. Along OX choose suitable width for each bar.
Step 4. Along OY choose an appropriate scale. Here choose 1 large division = 100 girls
Step 5. Calculate the heights of the various bars as follows:
(a) Height of bar for Scheduled caste =  = 9.4 large divisions
(b) Height of bar for Scheduled tribe =  = 9.7 large divisions
(c) Height of bar for Non SC / ST =  = 9.2 large divisions
(d) Height of bar for Backward districts =  = 9.5 large divisions
(e) Height of bar for Non-Backward districts = = 9.2 large divisions
(f) Height of bar for Rural =  = 9.3 large divisions
(g) Height of bar for Urban =  = 9.1 large divisions
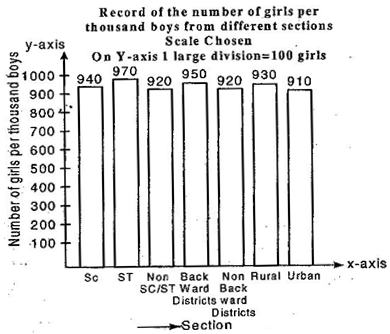
(ii) From the graph we observe that in each section the number of girls are nearly same. We also observe that the number of girls in each section are less than the boys.
NCERT Solutions for Class 9 Maths Exercise 14.3
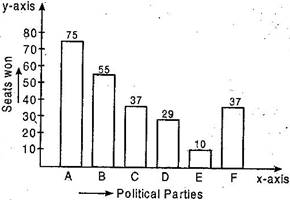
3. Given below are the seats won by different political parties in the polling outcome of a state assembly elections:
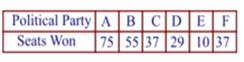
(i) Draw a bar graph to represent the polling results.
(ii) Which political party won the maximum number of seats?
Ans. (i) The given information in the form of a bar graph which is drawn as follws:
Scale chosen: On y-axis – 1 large division, i.e. 1 cm = 10 seats
(ii) Out of all won seats, 75 is the maximum. So party A has won maximum number of seats.
NCERT Solutions for Class 9 Maths Exercise 14.3
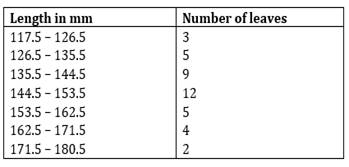
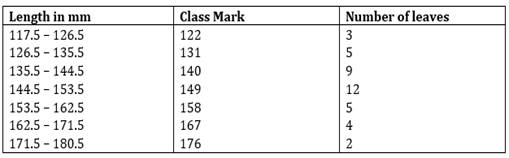
4. The length of 40 leaves of a plant are measured correct to one millimeter and the obtained data is represented in the following table:
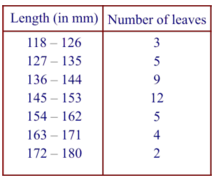
(i) Draw a histogram to represent the given data.
(ii) Is there any other suitable graphical representation for the same data?
(iii) Is it correct to conclude that the maximum number of leaves are 153 mm long? Why?
Ans. (i) Let us find half the difference between lower limit of a class and upper limit of its proceeding class to make the continuous distribution.
Representation of given data in the form of a histogram is as follows:
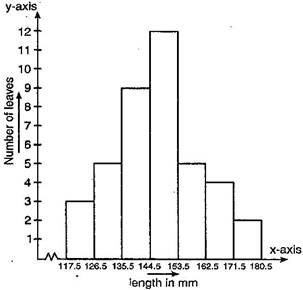
Length of 40 leaves of a plant measured correct to one millimeter.
Scale chosen: On y-axis – 1 large division, i.e. 1 cm = 1 leave
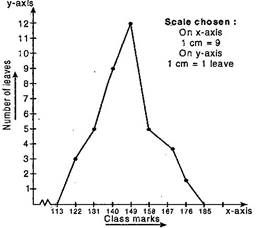
(ii) Yes, we can represent the given data by other graphical representation named as Frequency Polygon which is as follows:
(iii) No, because the maximum number 12 is corresponding to the class interval 145 -153 which implies that the leaves whose length are 145 mm or less than 153 mm are maximum in number.
NCERT Solutions for Class 9 Maths Exercise 14.3
5. The following table gives the life times of 400 neon lamps:
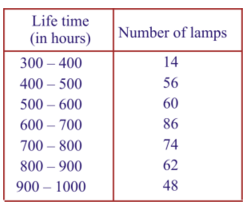
(i) Represent the given information with the help of a histogram.
(ii) How many lamps have a life time of more than 700 hours?
Ans. (i) Representation of the given in the form of histogram is as follows:
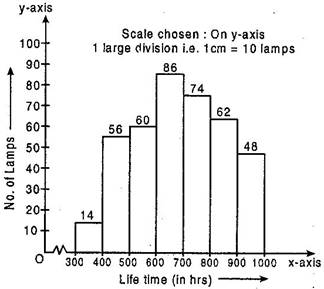
(ii) Number of lamps having lifetime of more than 700 hours = 74 + 62 +48 = 184
NCERT Solutions for Class 9 Maths Exercise 14.3
6. The following table gives the distribution of students of two sections according to the marks obtained by him:
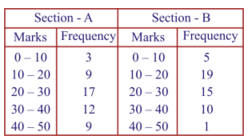
Represent the marks of the students of both the sections on the same graph by two frequency polygons. From the two polygons compare the performance of the two sections.
Ans. We plot the class-mark on x-axis and number of students on y-axis.
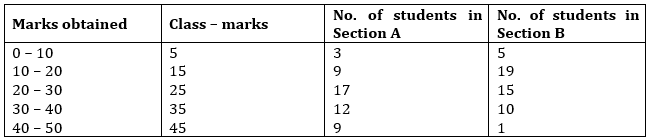
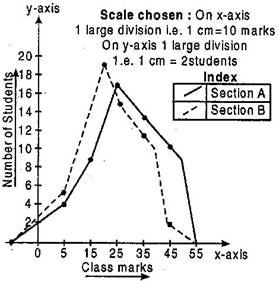
From the above graph, we observed that students of section A performed better because as we move right on x-axis the number of students are spread widely over greater marks as compared to the students of section A.
NCERT Solutions for Class 9 Maths Exercise 14.3
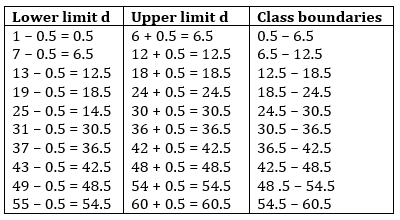
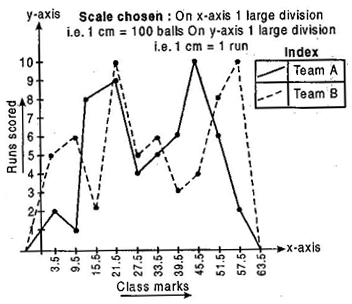
7. The runs scored by the two teams A and B in the first 60 balls in a cricket match are given below:
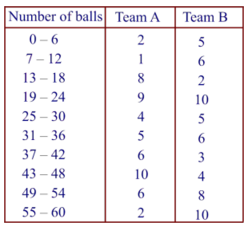
Represent the data of both the teams on the same graph by frequency polygons.
Ans. New series of given data for plotting the frequency polygon:
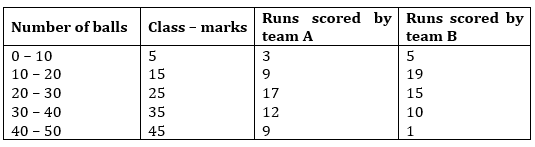
Frequency polygon of team A and team B
NCERT Solutions for Class 9 Maths Exercise 14.3
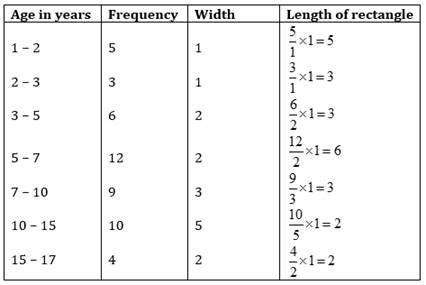
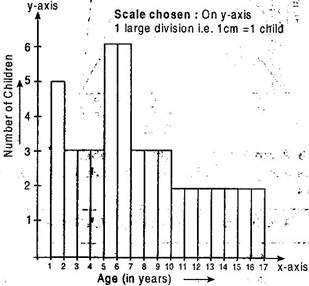
8. A random survey of the number of children of various age groups playing in a park was found as follows:
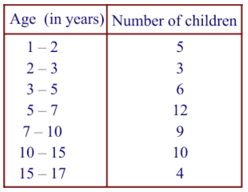
Draw a histogram to represent the data above.
Ans. Here the classes are not of equal size. Here minimum class is 1, therefore
The histogram using these lengths
NCERT Solutions for Class 9 Maths Exercise 14.3
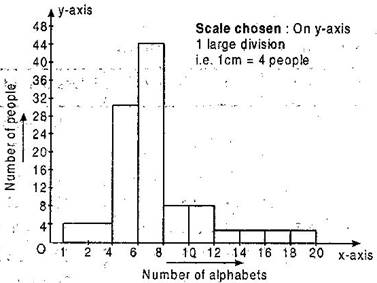
9. 100 surnames were randomly picked up from a local telephone directory and a frequency distribution of the number of letters in the English alphabet in the surnames was found as follows:
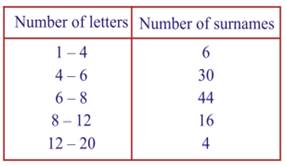
(i) Draw a histogram to depict the given information.
(ii) Write the class interval in which the maximum number of surnames lie.
Ans. Here the classes are not of equal size. Here minimum class is 1, therefore
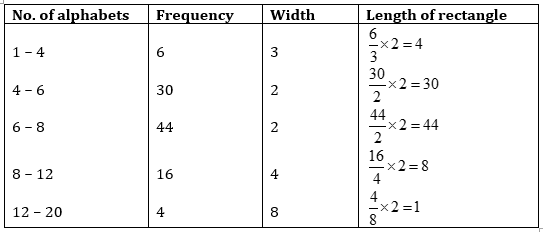
The histogram using these lengths
NCERT Solutions for Class 9 Maths Exercise 14.3
NCERT Solutions for Class 9 Maths PDF (Download) Free from myCBSEguide app and myCBSEguide website. Ncert solution class 9 Maths includes text book solutions from Mathematics Book. NCERT Solutions for CBSE Class 9 Maths have total 15 chapters. 9 Maths NCERT Solutions in PDF for free Download on our website. Ncert Maths class 9 solutions PDF and Maths ncert class 9 PDF solutions with latest modifications and as per the latest CBSE syllabus are only available in myCBSEguide.
CBSE app for Class 9
To download NCERT Solutions for Class 9 Maths, Computer Science, Home Science,Hindi ,English, Social Science do check myCBSEguide app or website. myCBSEguide provides sample papers with solution, test papers for chapter-wise practice, NCERT solutions, NCERT Exemplar solutions, quick revision notes for ready reference, CBSE guess papers and CBSE important question papers. Sample Paper all are made available through the best app for CBSE students and myCBSEguide website.
Test Generator
Create question paper PDF and online tests with your own name & logo in minutes.
Create Now
Learn8 App
Practice unlimited questions for Entrance tests & government job exams at ₹99 only
Install Now