NCERT Solutions for Class 9 Maths Exercise 14.2 book solutions are available in PDF format for free download. These ncert book chapter wise questions and answers are very helpful for CBSE board exam. CBSE recommends NCERT books and most of the questions in CBSE exam are asked from NCERT text books. Class 9 Maths chapter wise NCERT solution for Maths Book for all the chapters can be downloaded from our website and myCBSEguide mobile app for free.
NCERT solutions for Class 9 Maths Statistics Download as PDF
NCERT Solutions for Class 9 Mathematics Statistics
1. The blood groups of 30 students of a class VIII are recorded as follows:
A, B, O, O, AB, O, A, O, B, A, O, B, A, O, O, A, AB, O, A, A, O, O, AB, B, A, O, B, A, B, O
Represent this data in the form of a frequency distribution table. Which is the most common and which is the rarest blood group among these students?
Ans. The frequency distribution table for the given data is as follows:
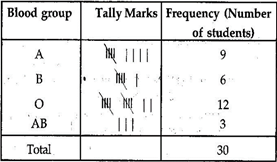
From the table we observe that most common blood groups is O and the rarest group is AB.
2. Distance (in km) of 40 engineers from their place of residence to their place of work were found as follows:
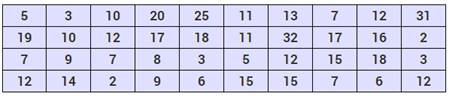
Construct a grouped frequency distribution table with class size 5 for the data given above taking the first interval as 0 – 5 (5 not included). What main features do you observe from this tabular representation?
Ans. The grouped frequency distribution table for the given data is as follows:
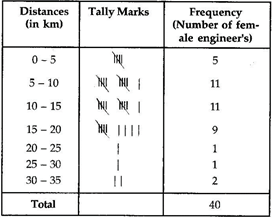
From the table we observe that out of 40 female engineers 36 (5 +11 + 11 + 9) engineers i.e. 90% of the total female engineers reside less than 20 km from their place of work.
3. The relative humidity (in %) of a certain city for a month of 30 days was as follows:
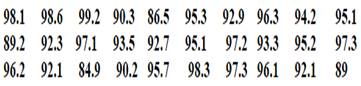
(i) Construct a grouped frequency distribution table with classes 84 – 86, 86 – 88 etc.
(ii) Which month or season do you think this data is about?
(iii) What is the range of this data?
Ans. (i) The grouped frequency distribution table for the given data is as follows:
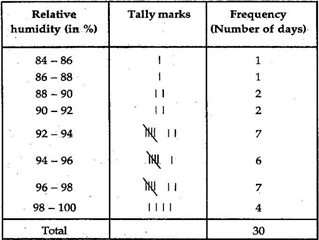
(ii) From the data we observe that relative humidity is high. So data appears to be taken in the rainy season.
(iii) From the data, we observe that
Highest relative humidity = 99.2%
Lowest relative humidity = 84.9%
Range = (99.2 – 84.9)% = 14.3%
NCERT Solutions for Class 9 Maths Exercise 14.2
4. The heights of 50 students, measured to the nearest centimeters have been found to be as follows:
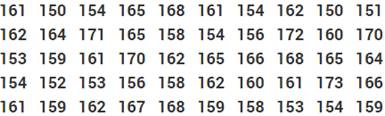
(i) Represent the data given above by a grouped frequency distribution table, taking the class – intervals as 160 – 165, 165 – 170 etc.
(ii) What can you conclude about their heights from the table?
Ans. (i) The grouped frequency distribution table for the given data is as follows:
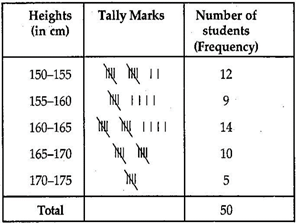
(ii) From the frequency distribution table drawn above, we conclude that more than 50% of the students are shorter than 165 cm.
NCERT Solutions for Class 9 Maths Exercise 14.2
5. A study was conducted to find out the concentration of sulphur dioxide in the air in parts per million (ppm) of a certain city. The data obtained for 30 days is as follows:
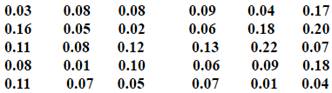
(i) Make a grouped frequency distribution table for this data with class intervals as 0.01 – 0.04, 0.04 – 0.08 and so on.
(ii) For how many days, was the concentration of sulphur dioxide more than 0.11 parts per million.
Ans. (i) The grouped frequency distribution table for the given data is as follows:
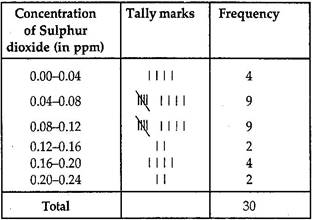
(ii) From the above frequency distribution we observe that the concentration of Sulphur dioxide was more than 0.11 ppm for 8 days.
NCERT Solutions for Class 9 Maths Exercise 14.2
6. Three coins were tossed 30 times simultaneously. Each time the number of heads occurring was noted down as follows:
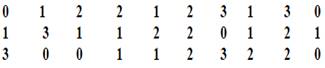
Prepare a frequency distribution for the data given above.
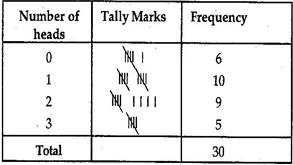
Ans. (i) The grouped frequency distribution table for the given data is as follows:
NCERT Solutions for Class 9 Maths Exercise 14.2
7. The value of  up to 50 decimal places is given below:

(a) Make a frequency distribution of the digits after the decimal point list the digits from 0 to 9 in your first column.
(b) What are the most and the least frequency occurring digits?
Ans. (a) The value of up to 50 decimal places is given as table:
The frequency distribution table of the digits after the decimal point in the value of is as follows:
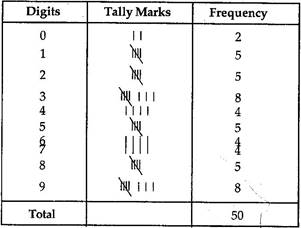
(b) Maximum frequency is 8.
Hence 3 is the most frequently occurring digit.
Least frequency is 2.
Hence 0 is the least occurring digit.
NCERT Solutions for Class 9 Maths Exercise 14.2
8. Thirty children were asked about the number of hours they watched TV programmers in the previous week. The results were found as follows:
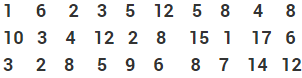
(i) Make a frequency distribution table for this data, taking class width 5 and one of the class interval 5 – 10.
(ii) How many children watched television for 15 or more hours a week?
Ans. (i) Frequency distribution table for the given data is as follows:
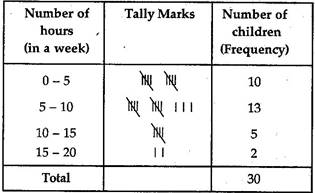
(ii) From the frequency table we observe that number of children in the class interval 15 – 20 is 2.
So 2 children view television for 15 hours or more than 15 hours a week.
NCERT Solutions for Class 9 Maths Exercise 14.2
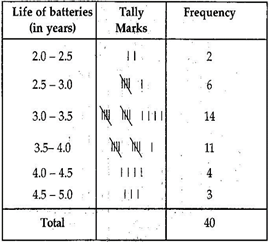
9. A company manufactures car-batteries of particular type. The live (in years) of 40 such batteries were recorded as follows:
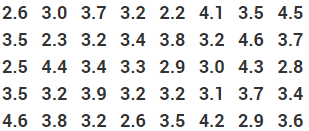
Construct a grouped frequency distribution table for this data, using class intervals of size 0.5 starting from the interval 2 – 2.5.
Ans. Grouped frequency distribution table for the given data is as follows:
NCERT Solutions for Class 9 Maths Exercise 14.2
NCERT Solutions for Class 9 Maths PDF (Download) Free from myCBSEguide app and myCBSEguide website. Ncert solution class 9 Maths includes text book solutions from Mathematics Book. NCERT Solutions for CBSE Class 9 Maths have total 15 chapters. 9 Maths NCERT Solutions in PDF for free Download on our website. Ncert Maths class 9 solutions PDF and Maths ncert class 9 PDF solutions with latest modifications and as per the latest CBSE syllabus are only available in myCBSEguide.
CBSE app for Class 9
To download NCERT Solutions for Class 9 Maths, Computer Science, Home Science,Hindi ,English, Social Science do check myCBSEguide app or website. myCBSEguide provides sample papers with solution, test papers for chapter-wise practice, NCERT solutions, NCERT Exemplar solutions, quick revision notes for ready reference, CBSE guess papers and CBSE important question papers. Sample Paper all are made available through the best app for CBSE students and myCBSEguide website.
Test Generator
Create question paper PDF and online tests with your own name & logo in minutes.
Create Now
Learn8 App
Practice unlimited questions for Entrance tests & government job exams at ₹99 only
Install Now