CBSE Economics Chapter 6 Measures of Dispersion class 11 Notes Economics in PDF are available for free download in myCBSEguide mobile app. The best app for CBSE students now provides Measures of Dispersion class 11 Notes Economics latest chapter wise notes for quick preparation of CBSE exams and school based annual examinations. Class 11 Economics notes on Chapter 6 Measures of Dispersion class 11 Notes Economics are also available for download in CBSE Guide website.
CBSE Guide Measures of Dispersion class 11 Notes
CBSE guide notes are the comprehensive notes which covers the latest syllabus of CBSE and NCERT. It includes all the topics given in NCERT class 11 Economics text book. Users can download CBSE guide quick revision notes from myCBSEguide mobile app and my CBSE guide website.
Measures of Dipersion class 11 Notes Economics
Download CBSE class 11th revision notes for Chapter 6 Measures of Dispersion class 11 Notes Economics in PDF format for free. Download revision notes for Measures of Dispersion class 11 Notes Economics and score high in exams. These are the Measures of Dispersion class 11 Notes Economics prepared by team of expert teachers. The revision notes help you revise the whole chapter in minutes. Revising notes in exam days is on of the best tips recommended by teachers during exam days.
Download Revision Notes as PDF
CBSE Class 11 Economics
Revision Notes
Chapter – 6
Measures of Dispersion class 11 Notes Economics
Points to remember
Dispersion is a measure of the variation of the items from central value.
The measures of dispersion is important to compare uniformity, consistency and reliability amongst variables / series.
Absolute measures of dispersion are expressed in terms of original unit of series.
Relative measures are expressed in ratios or percentage of average, also known as coefficients of dispersion.
Measures of Dispersion:
(i) Range
(ii) Inter quartile range
(iii) Quartile deviation or Semi-Inter-quartile range
(iv) Mean deviation
(v) Standard Deviation
(vi) Lorenz curve
Range: Range is defined as the difference between two extreme observations i.e. the largest and the smallest value.
Symbolically, R = L-S
Where R = Range
L = Largest Value
S = Smallest value
Coefficient of range = 
Inter Quartile Range:
Inter quartile range is the difference between upper quartile and lower quartile.
Inter-quartile range = 
Where  = Third quartile or upper quartile.
 = First quartile or lower quartile
Quartile Deviation:
Quartile deviation is known as half of difference of third quartile () and first quartile (). It is also known as semi inter quartile range.
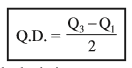
Where Q.D. = Quartile deviation
= Third quartile or upper quartile.
= First quartile of lower quartile.
Coefficient of quartile deviation=
Mean Deviation:
Mean deviation/average deviation is the arithmetic mean of the deviations of various items from their average (mean, median or mode) generally from the median.
Calculation of mean deviation
Individual Series 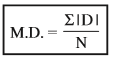
Discrete Series 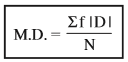
Continuous Series 
Where,
MD = Mean deviation
| D | = Deviations from mean or median ignoring + Signs
N = Number of item (Individual Series)
N = Total number of Frequencies (Discrete and continuous series)
F = Number of frequencies.
Coefficient of mean deviation
Merit of Mean deviation:
- As in case of X, every term is taken in account hence, it is certainly a better measure than other measures of dispersion i.e. Range, Percentile Range or Quartile Range.
- Mean deviation is extensively used in other fields such as Economics, Business, Commerce or any other field of such type.
- It has least sampling fluctuations as compared to Range, Percentile Range and Quartile Deviation.
- When comparison is needed this is perhaps the best measure between two or more series.
- This calculation has its base upon measurement than an estimate.
- Mean Deviation is rigidly defined; one of the main focus point of any measure used for statistical Analysis.
- It we calculate it from median it is less affected by extreme terms.
- As it is based on the deviations about an average, it gives us better measure for comparison.
Demerits of Mean Deviation:
- If average is in fractions, it is difficult to compile M.D.
- Main property is absent, It is not capable of further Algebraic Treatment.
- Not so easy to calculate to calculate X, M or Z first and then to go for other measures.
- If it is calculated from Z it is not much reliable as Mode (Z) is not the true representative of the series.
- M.D. and its co-efficient taken from X, M and Z often differ.
- As +,- signs are ignored which is not possible mathematically. Algebraically we have to proceed for Standard Deviation; or another measure of dispersion.
- As for mean, open and series cannot be taken for the true result.
- If Range increases in case the sample increases, Average deviation also increases but not in the same ratio.
- For Sociological studies, it is almost not used.
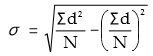
Standard Deviation:
Standard deviation is the best and widely used measure of dispersion. Standard deviation is the square root of the arithmetic mean of the squares of deviation of its items from their arithmetic mean. Calculation of standard deviation in individual series.
Actual mean method.
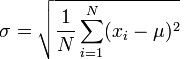
Where  = Standard Deviation
 = Sum total of square of Deviation taken from Mean
N = Number of items
Shortcut Method or assumed mean method:
Where  = Square of deviation taken from assumed mean.
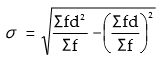
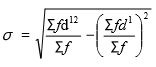
Calculation of standard deviation in discrete series:
Actual mean method or direct method

Where  = S.D.
 = Sum total of the squared deviations multiplied by frequency
N = Number of pair of observations.
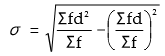
Shortcut method or assumed method:
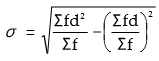
 = S.D.
 = Sum total of the squared deviations Multiplied by frequency
= Sum total of deviations multiplied by frequency.
N = Number of pair of observations.
Step deviation method:
X C
= Standard Deviation
= Sum total of the squared step deviations multiplied by frequency.
= Sum total of step deviations multiplied by frequency
C = Common factor
N = Number of pair of observation
Individual Series:
1. Actual Mean Method


2. Assumed Mean Method
Discrete/Continuous Series:
1. Actual Mean Method

2. Assumed Mean Method
3. Step Deviation Method
 X C
X C
Merits of standard donation:
1. Based on all values
2. Rigidly defined
3. Less effect of fluctuations
4. Capable of algebraic treatment
Demerits of standard donation:
1. Difficult to compute
2. More stress on extreme items
3. Dependent on unit of measurement.
Coefficient of variation:
When two or more groups of similar data are to be compared with respect to stability (or uniformly or consistency or homogeneity). Coefficient of variation is the most appropriate measures. It is the ratio of the standard deviation to the mean.

Where C.V. = Coefficient of variation
= Standard deviation
X = Arithmetic mean
LORENZ CURVE:
The Lorenz curve devised by Dr. Max O. Lorenz is a graphic method of studying dispersion.
The Lorenz curve always lies-below the line of equal distribution, unless the distribution is uniform.
The Area between the line of equal distribution and the plotted curve gives the extent of inequality in the items. The larger the area, more is the inequality.
Application Lorenz Curve:
(i) Distribution of income
(ii) Distribution of wealth
(iii) Distribution of wages
(iv) Distribution of production
(v) Distribution of population
Construction of Lorenz Curve:
1. Series is converted into a cumulative frequency series. The cumulative sum of items is assumed to be 100 and different items are converted into percentage of the cumulative sum.
2. Cumulative sum of frequency is assumed to be 100 and different Frequencies are converted into percentage of sum of frequency.
3. Cumulative frequencies are plotted on x-axis and cumulative items are plotted on y-axis of graph.
4. On both axis values are plotted from 0-100.
5. A diagonal line(0 on X-axis and 100 on Y-axis are joined by a line). It is called line of equal distribution.
6. Actual data are plotted by joining different points. This is Lorenz Curve.
7. Lesser distance between the line of equal distribution and line of actual distribution shows lesser dispersion and so on.
Measures of Dispersion class 11 Notes
- CBSE Revision notes (PDF Download) Free
- CBSE Revision notes for Class 11 Economics PDF
- CBSE Revision notes Class 11 Economics – CBSE
- CBSE Revisions notes and Key Points Class 11 Economics
- Summary of the NCERT books all chapters in Economics class 11
- Short notes for CBSE class 11th Economics
- Key notes and chapter summary of Economics class 11
- Quick revision notes for CBSE exams
CBSE Class-11 Revision Notes and Key Points
Measures of Dipersion class 11 Notes Economics. CBSE quick revision note for class-11 Mathematics, Physics, Chemistry, Biology and other subject are very helpful to revise the whole syllabus during exam days. The revision notes covers all important formulas and concepts given in the chapter. Even if you wish to have an overview of a chapter, quick revision notes are here to do if for you. These notes will certainly save your time during stressful exam days.
- Revision Notes for class-11 Physics
- Revision Notes for class-11 Chemistry
- Revision Notes for class-11 Mathematics
- Revision Notes for class-11 Biology
- Revision Notes for class-11 Accountancy
- Revision Notes for class-11 Economics
- Revision Notes for class-11 Business Studies
- Revision Notes for class-11 Computer Science
- Revision Notes for class-11 Informatics Practices
- Revision Notes for class-11 Geography
To download Measures of Dispersion class 11 Notes, sample paper for class 11 Chemistry, Physics, Biology, History, Political Science, Economics, Geography, Computer Science, Home Science, Accountancy, Business Studies and Home Science; do check myCBSEguide app or website. myCBSEguide provides sample papers with solution, test papers for chapter-wise practice, NCERT solutions, NCERT Exemplar solutions, quick revision notes for ready reference, CBSE guess papers and CBSE important question papers. Sample Paper all are made available through the best app for CBSE students and myCBSEguide website.
- Introduction class 11 Notes Economics
- Collection of Data class 11 Notes Economics
- Organisation of Data class 11 Notes Economics
- Presentation of Data class 11 Notes Economics
- Measures of Central Tendency class 11 Notes Economics
- Measures of Dispersion class 11 Notes Economics
- Correlation class 11 Notes Economics
- Introduction to Index Number class 11 Notes Economics
- Indian Economy on the Eve of Independence class 11 Notes Economics
- Indian Economy 1950-1990 class 11 Notes Economics
- Economic Reform Since 1991 class 11 Notes Economics
- Poverty class 11 Notes Economics
- Human Capital Formation in India class 11 Notes Economics
- Rural Development class 11 Notes Economics
- Employment : Growth, Informalisation and Other Issues class 11 Notes Economics
- Infrastructure class 11 Notes Economics
- Environment and Sustainable Development class 11 Notes Economics
- Inflation Problem and Policies class 11 Notes Economics
- Development Experience Of India a Comparison with Neighbours class 11 Notes Economics
Test Generator
Create question paper PDF and online tests with your own name & logo in minutes.
Create Now
Learn8 App
Practice unlimited questions for Entrance tests & government job exams at ₹99 only
Install Now