CBSE Sample Question Paper for Class 11 Economics – in PDF
CBSE Sample Papers for Class 11 Economics for the 2024-25 session are now available for free download on the myCBSEguide app and myCBSEguide website. These sample papers are designed based on the latest CBSE marking scheme and the official blueprint released for Class 11 Economics exams. Practicing these sample papers will help students familiarize themselves with the exam format and question types. or teachers who want to create customized practice papers, Examin8 app and Examin8 website is the ideal tool. Teachers can use Examin8 to generate personalized question papers with their name and logo, making it easier to provide tailored resources for students.
Key Features:
- Free Download: Access Class 11 Economics sample papers in PDF format from the myCBSEguide app or myCBSEGuide website.
- CBSE-Aligned: Our sample papers are designed as per the CBSE Class 11 Economics syllabus for 2024-25, ensuring accurate and up-to-date exam practice.
- Marking Scheme & Blueprint: All sample papers follow the official CBSE marking scheme and blueprint, guiding students to answer questions effectively.
- Comprehensive Practice: These papers cover all major topics in Economics, giving students an opportunity to practice a wide range of questions, including MCQs and descriptive answers.
- Understand Exam Patterns: After practicing these model papers, students will have a clear understanding of how to approach Class 11 CBSE Economics exams and boost their exam confidence.
How to Download:
- Visit the myCBSEguide website or download the myCBSEguide app.
- Navigate to the Class 11 Economics Sample Papers 2024-25 section.
- Download the sample papers in PDF format and begin your preparation.
Start practicing today with CBSE Class 11 Economics Sample Papers and improve your chances of scoring well in the 2024-25 CBSE exams.
Download Economics Sample Papers as PDF
CBSE Sample Papers Class 11 Economics 2024-25
CBSE Class 11 Economics Sample Papers 2025 are now available for free download on the myCBSEguide app and myCBSEguide website. These sample papers are designed to align with the latest CBSE blueprint and marking scheme for the current academic session. Students are strongly advised to practice these model question papers to enhance their exam preparation and improve their chances of success. Teachers can also take advantage of the Examin8 App and Examin8 Website to create custom exam papers with their name and logo. This powerful tool allows educators to generate personalized assessments, making it easier to track student progress and tailor their teaching approach.
Key Features of Class 11 Economics Sample Papers 2025:
- Well-Explained Solutions: Each Class 11 Economics sample paper 2025 comes with detailed solutions to help students understand the steps involved in solving each question.
- Two Sections: The sample papers are divided into two sections—Microeconomics and Statistics. Each section carries equal weightage of 40 marks, while the remaining 20 marks are allocated for internal assessment.
- Aligned with CBSE Blueprint: The sample papers strictly follow the CBSE blueprint for Class 11 Economics, ensuring that students are well-prepared for the actual exam format.
- Balanced Question Distribution: Questions are distributed between Microeconomics and Statistics to help students evenly distribute their study time across both topics.
- Comprehensive Practice: By practicing these sample papers, students will familiarize themselves with the types of questions likely to appear in the final exam and develop a stronger grasp of the subject.
Why Practice CBSE Class 11 Economics Sample Papers 2025?
- Boost Exam Readiness: Practicing model papers enhances your ability to solve questions efficiently and improves your exam timing.
- Understand Question Format: The sample papers provide a clear picture of the exam pattern, helping students understand how questions are framed and how to answer them correctly.
- Improve Marks: Consistent practice will help boost your confidence, allowing you to score better in the Class 11 Economics exam.
How to Download:
- Visit myCBSEguide website or download the myCBSEguide app.
- Go to the Class 11 Economics Sample Papers 2025 section.
- Download the sample papers with solutions in PDF format and start practicing.

Class 11 – Economics
Sample paper – 01 (2024-25)
Maximum Marks: 80
Time Allowed: : 3 hours
General Instructions:
- This question paper contains two sections:
Section A – Micro Economics
Section B – Statistics - This paper contains 20 Multiple Choice Questions type questions of 1 mark each.
- This paper contains 4 Short Answer Questions type questions of 3 marks each to be answered in 60 to 80 words.
- This paper contains 6 Short Answer Questions type questions of 4 marks each to be answered in 80 to 100 words.
- This paper contains 4 Long Answer Questions type questions of 6 marks each to be answered in 100 to 150 words.
- Section A
- Assertion (A): Statistics cannot calculate the qualitative aspects of economics.
Reason (R): Qualitative aspects are the aspects that influence the working of an economy, though cannot be expressed in terms of money.a) Both A and R are true and R is the correct explanation of A.b) Both A and R are true but R is not the correct explanation of A.c) A is true but R is false.d) A is false but R is true. - Formula for calculating price index is
a) Price index = {tex}P1/P0 * 100{/tex}b) {tex}II{P_{01}} = {\text{ }}\frac{{\sum {(\frac{{{q_1}}}{{{q_0}}}){\text{ P}}} }}{{\sum P }}{/tex}c) None of thesed) {tex}II{P_{01}} = {\text{ }}\frac{{\sum {(\frac{{{q_1}}}{{{q_0}}}){\text{ P}}} }}{{\sum W }}{/tex}
- If the coefficient correlation exactly equals to -1 then it will be effect
a) Negative correlationb) Simple correlationc) Positive correlationd) Multiple correlation
- Taking 1999 as base year calculate index number of the year 2000
Year 1999 2000 2001 2002 2003 2004 Price (Rs) 10 14 16 20 22 24 a) 160b) 130c) 140d) 150 - Which of the following index numbers is based on the assumption that all the commodities are of equal importance?
a) Weighted index number and Simple index numberb) Simple index numberc) None of the givend) Weighted index number
- Which of the following plays an important role in the construction of index numbers?
a) Current year priceb) All of thesec) Base year priced) Weights
- The scope of statistics extends to
a) governmentb) All of thesec) economicsd) industry
- The total expenditure incurred by an industry under different heads is best presented by
a) Histogramb) Compound graphc) Line graphd) Component Bar Diagram
- A composite price index based on the prices of a group of items is known as the
a) Laspeyres Indexb) CPIc) Paasche Indexd) Aggregate price index
- Calculate the correlation coefficient between x and y and comment on their relationship
X 3 2 1 1 2 3 Y 9 4 1 1 4 9 a) 0.47b) 0.25c) 0.0d) 0.99 - Give reason as to why weighted index number is generally preferred to an unweighted index number?
To prepare effectively for your exams, download the myCBSEguide App and myCBSEGuide Website. This app offers a comprehensive range of study materials, including sample papers, solutions, and practice questions for CBSE, NCERT, JEE (Main), NEET-UG, and NDA exams. It’s designed to help students build a solid foundation and enhance their exam readiness.Teachers can also take advantage of the Examin8 App and Examin8 Website to create custom exam papers with their name and logo. This powerful tool allows educators to generate personalized assessments, making it easier to track student progress and tailor their teaching approach.Whether you’re a student or a teacher, myCBSEguide and Examin8 are the perfect apps to streamline learning and teaching. Download them now to start preparing for success! - Following table gives marks in Statistics of the students of class XI. Find out mean marks using direct method.
Mid-Value 5 10 15 20 25 30 Number of Students 5 7 9 10 8 6 OR
Average daily wages of 50 workers of a factory was Rs.200. Each worker is given a raise of Rs.20. What is the new average daily wages? Which property of arithmetic mean does the above example point to?
- Prepare a frequency distribution by inclusive method taking class interval of 7 from the following data
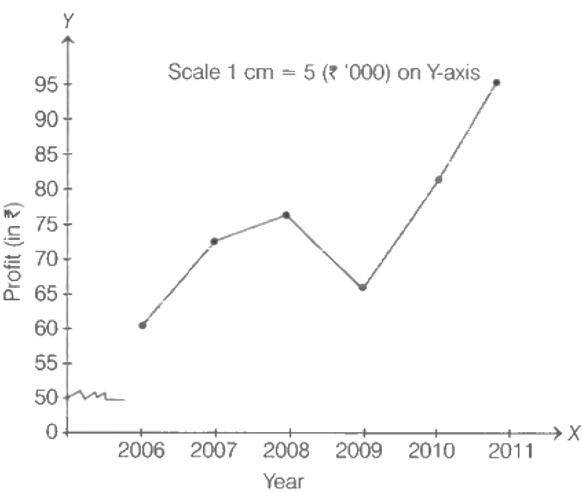
28, 17, 15, 22, 29, 21, 23, 27, 18, 12, 7, 2, 9, 4, 1, 8, 3, 10, 5, 20, 16, 12, 8, 4, 33, 27, 21, 15, 3, 36, 27, 18, 9, 2, 4, 6, 32, 31, 29, 18, 14, 13, 15, 11, 9, 7, 1, 5, 37, 32, 28, 26, 24, 20, 19, 25, 19, 20, 6, 9 - Show the annual profit figures of a firm with the help of a time series graph.
Year Profit (in Rs. ‘000) 2006 60 2007 72 2008 75 2009 65 2010 80 2011 95 OR
What are the general rules to construct a Time Series graph?
- What do you understand by non-sampling errors? Explain briefly the types of non-sampling errors.
- Find out rank difference correlated of X and Y.
X 80 78 75 75 58 67 60 59 Y 12 13 14 14 14 16 15 27 - Calculate the mode from the following data.
Marks (Mid-value) 5 10 15 20 25 30 35 40 45 Number of Students 7 13 19 24 32 28 17 8 6 OR
Calculate the median of the following distribution of data.
Class Interval 0-10 10-30 30-60 60-80 80-90 Frequency 5 15 25 8 3 - Section B
- Supply curve shifts forward due to:
a) decrease in price of competing productb) decrease in factor pricec) increase of firms in the marketd) all of these
- If many people die due to an earthquake, it will shift the country’s PPC to the
a) Rightb) Leftc) Not affectedd) Can’t say
- When will increase in supply bring down the price, leaving the quantity demanded unchanged?
a) When demand for the commodity is perfectly inelasticb) When demand for the commodity is less elasticc) When demand for the commodity is perfectly elasticd) When demand for the commodity is more elastic
- The relationship between TR and MR when price is constant.
a) MR will be constant but TR is a positively sloped straight lineb) The values are samec) The values decreased) The values increase
- TC increases at an increasing rate when MC is:
a) negativeb) constantc) increasingd) decreasing
- Assertion (A): The demand curve of the complementary good shifts to the right.
Reason (R): Greater purchase of a commodity at its constant price points to a situation of increase in demand or a forward shift in the demand curve.a) Both A and R are true and R is the correct explanation of A.b) Both A and R are true but R is not the correct explanation of A.c) A is true but R is false.d) A is false but R is true.
Boost your exam preparation with the myCBSEguide App and myCBSEGuide Website, the ultimate resource for CBSE, NCERT, JEE (Main), NEET-UG, and NDA exams. This app provides a wide range of study materials, including practice papers, chapter-wise solutions, NCERT Exemplar solutions, and quick revision notes to ensure you’re fully prepared for your exams. It’s the best companion for students aiming for top scores in their board and entrance exams. CBSE Sample Papers Class 11 Economics offer a comprehensive review of all topics covered in the syllabus.Teachers can also benefit from the Examin8 App and Examin8 Website, which enables them to create custom exam papers with their personal branding, including name and logo. This tool helps educators design effective, personalized assessments for their students.With myCBSEguide and Examin8, both students and teachers can streamline their study and teaching processes for optimal results. Download these apps today to start preparing smarter! - If the demand curve of a firm is a horizontal straight line:
a) all firms will sell equal amount of a commodityb) firms can differentiate their productc) a firm can sell only a specified amount at the existing priced) a firm can sell any amount at the existing price
- Can MR be negative or zero.
a) Can’t sayb) Noc) Yesd) Only negative but not zero
- Implicit costs are
a) Same as explicit costsb) Total costc) Opportunity costsd) Imputed costs
- Under which market situation demand curve is linear and parallel to X-axis?
a) Perfect competitionb) Monopolyc) Oligopolyd) Monopolistic competition
- State three reasons which give rise to an economic problem.
OR
What are the three central problems of an economy?
- What conditions must hold if a profit-maximizing firm produces positive output in a competitive market?
- Why should diamonds be priced so high and water be priced so low even when water is essential to sustain life while diamonds are not?
- Explain the conditions of producer’s equilibrium with the help of a schedule, assuming that the producer can sell more at the same price.
OR
Is a producer in equilibrium under the following situations?
- When marginal revenue is greater than marginal cost.
- When marginal revenue is equal to marginal cost.
Give reasons for your answer.
- Show that demand of a commodity is inversely related to its price. Explain with the help of utility analysis.
- Explain the law of variable proportion with the help of diagram/schedule.
- Answer the following questions
- When the price of a good falls by 10%, its demand rises from 200 units to 220 units. Calculate its price elasticity of demand.
- On the basis of the following schedule, calculate price elasticity of demand by the percentage method.
Price Per
unit (Rs.)Total Expenditure Demand 10 180 18 9 162 18 Prepare for your exams efficiently with the myCBSEguide App and myCBSEGuide Website, offering complete study material for CBSE, NCERT, JEE (Main), NEET-UG, and NDA exams. The app includes practice papers, chapter-wise solutions, NCERT Exemplar answers, and quick revision notes to help you master the syllabus. It’s the perfect tool for students who want to improve their exam performance and boost their confidence. Practicing CBSE Sample Papers Class 11 Economics enhances your understanding of complex economic concepts.
Teachers can also benefit from the Examin8 App and Examin8 Website , which allows them to create personalized exam papers with their own name, logo, and branding. This helps educators design unique assessments tailored to their students’ needs.
With both apps, students and teachers can access high-quality resources for better exam preparation and teaching. Download myCBSEguide and Examin8 now to get started!
Class 11 – Economics
Sample paper – 01 (2024-25)
Solution
-
- Section A
- (b) Both A and R are true but R is not the correct explanation of A.
Explanation: Both A and R are true but R is not the correct explanation of A. - (a) Price index = {tex}P1/P0 * 100{/tex}
Explanation: To calculate the Price Index, take the price of the Market Basket of the year of interest and divide by the price of the Market Basket of the base year, then multiply by 100. - (a) Negative correlation
Explanation: Because a negative value of correlation indicates an inverse relation. - (c) 140
Explanation: Here, P1=14, P0=10. Thus, Price index {tex}{\rm{P01 = }}\frac{{{\rm{P1}}}}{{{\rm{P0}}}}{\rm{ \times }}100 = \frac{{14}}{{10}} \times 100 = 140{/tex} - (b) Simple index number
Explanation: Simple index numbers grant equal importance to all items no matter what share it has. In other words, it considers each item to be equal with respect to the given variable. - (b) All of these
Explanation: Base year price, current year price and weights play important role in the construction of index number. - (b) All of these
Explanation: Statistics is used by the government as the role of government has increased and requires much greater information in the form of numerical figures to fulfil the welfare objectives. Statistics is also an indispensable tool for a proper understanding of various economic problems. Statistics is also useful for Industries as it helps in forecasting, production planning, quality control etc. - (d) Component Bar Diagram
Explanation: Component bar diagrams or charts, also called subdiagrams, are very useful in comparing the sizes of different component parts (the elements or parts which a thing is made up of) and also for throwing light on the relationship among these integral parts. For example, sales proceeds from different products, expenditure pattern in a typical Indian family (components being food, rent, medicine, education, power, etc.), budget outlay for receipts and expenditures, components of labour force, population etc. Component bar diagrams are usually shaded or coloured suitably. - (d) Aggregate price index
Explanation: A composite index number is a number that measures an average relative changes in a group of relative variables with respect to base whereas a simple index number is a number that measures a realive change in a single variable with respect to base.So, composite index number is based on an aggregate of items.
Prepare for your exams with the myCBSEguide App and myCBSEGuide Website, an all-in-one platform designed to support your academic journey. Whether you’re preparing for CBSE, NCERT, JEE (Main), NEET-UG, or NDA exams, this app offers a wide array of study materials, sample papers, and expert-curated resources to help you succeed. Stay on track with the right study content and clear your concepts efficiently, making exam preparation more streamlined and effective. You can download CBSE Sample Papers Class 11 Economics from various online educational platforms.For teachers, the Examin8 App and Examin8 Website is a powerful tool that allows you to create custom mock tests and practice papers with your own name and logo. This app provides a unique opportunity for educators to design personalized assessments, making teaching more engaging and interactive. Whether you’re a student or a teacher, these apps are designed to enhance learning and improve exam performance.Get ready to boost your academic performance—download the myCBSEguide App and Examin8 App today! - (d) 0.99
Explanation:X Y {tex}dX{/tex} {tex}dY{/tex} {tex}dX^2{/tex} {tex}dY^2{/tex} {tex}dXdY{/tex} 3 9 1 5 1 25 5 2 (A) 4 (A) 0 0 0 0 0 1 1 -1 -3 1 9 3 1 1 -1 -3 1 9 3 2 4 0 0 0 0 0 3 9 1 5 1 25 5 ∑ 0 4 4 68 16 r = {tex}N∑XY-∑X∑Y\over\sqrt{N∑X^2-(∑X)^2}\sqrt{N∑Y^2-(∑Y)^2}{/tex}
= {tex}6(16)-(0)(4)\over\sqrt{6(4)-(0)^2}\sqrt{6(68)-(4)^2}{/tex} = 0.99 - A weighted index is preferred to unweighted because:
(a) It gives different weights to different items as per their importance.
(b) Its results are more reliable.
(c) It is more accurate and useful. - In this series, mid-values are given. The calculation of arithmetic mean involves the same procedure as in the case of exclusive series. We have to multiply the mid values with f and then find {tex}\Sigma fm{/tex} and divide it by {tex}\Sigma f.{/tex}
Calculation of Arithmetic Mean
Mid-Value (m) Number of Students (f) fm 5 5 25 10 7 70 15 9 135 20 10 200 25 8 200 30 6 180 {tex}\Sigma f = 45{/tex} {tex}\Sigma f m = 810{/tex} So, we get {tex}\Sigma fm = 810 {/tex} and {tex}\Sigma f = 45 {/tex}. Applying the formula of mean, we get
{tex}\overline { X } = \frac { \Sigma f m } { \Sigma f } = \frac { 810 } { 45 } = 18{/tex}
Hence, required arithmetic mean=18 marksOR
Increase in wages of each worker =Rs.20
Total increase in wages = 50 x 20 = Rs.1000
Total wages before increase in wages= 50 x 200 = Rs.10,000
Total wages after increase in wages=10,000+1000=Rs.11,000
New average wage= {tex}\frac { \Sigma X } { n } = \frac { 11,000 } { 50 } = Rs. 220{/tex}
Thus, the mean wage has increased by Rs.20.
The property of arithmetic mean which is reflected here is that if each observation of a series is increased or decreased by a constant, say k, then the arithmetic mean of the new series also gets increased or decreased by k. In this case, each item is increased by 20, so the mean also increases by 20. - We first find the lowest value in the given data and then the highest value. Then, in order to prepare inclusive frequency distribution, we need class size which is given as 7. Then, we form inclusive class intervals with respective frequency as visible in the given data. As in the question, the lowest value is 1 and the highest is 37. With the help of tally bar, inclusive frequency distribution will be derived.
The frequency distribution by the inclusive method of given data is shown below:Class Interval Tally Bar Frequency (f) 1-7 
15 8-14 ||12 15-21 15 22-28 10 29-35 |6 36-42 || 2 Total 60 - As per the question, year 2006 to 2011 and their respective profits are given Here, we take profit on the Y- axis and year on the X-axis. Before plotting the graph, we take a false baseline because the profit starts from 60 and there are very small fluctuations in the remaining values of profit, so we take a false base of 50 and then we take the scale as 1 cm = 5 (in thousands). The time series graph of given annual profit figures is shown below:
OR
General rules to construct a time Series graph
- Since time can never be in negative values, II and III quadrant are not used in making of time series graphs.
- Time period (week, Month, Year) is taken on X- Axis. And Variable under study is taken on Y-Axis.
- We start Y axis with Zero and decide the scales for both the axis.
- Different values are plotted on the graph.
- By joining these points, we get a time series graph.
Time series graph can be of three types:
- One Variable Graph.
- Two or more than two variable Graph.
- When False Base Line is used.
- Graphs of Different Units.
- These errors are a consequence which can be traced and may arise at any stage of inquiry, viz planning and execution of the survey and collection, processing and analysis of data.
some of the non-sampling errors are:- Errors in Data Acquisition It arises from the recording of incorrect responses.
- Non-response Errors It occurs, if an interviewer is unable to contact a person listed .
- Sampling Bias It occurs when the sampling plan is such that some members of the target population could not possibly be included.
-
X R1 Y R2 D=R1-R2 D2 80 1 12 8 -7 49 78 2 13 7 -5 25 75 3.5 14 5 -1.5 2.25 75 3.5 14 5 -1.5 2.25 58 8 14 5 3 9 67 5 16 2 3 9 60 6 15 3 3 9 59 7 17 1 6 36 {tex}\sum {{D^2}} = 141.5{/tex} {tex}rk = 1 – \frac{{6\left[ {\sum {{D^2} + \frac{1}{{12}}(m_1^3 – {m_1})\frac{1}{{12}}\left( {m_2^3 – {m_2}} \right)} } \right]}}{{{N^3} – N}}{/tex}
{tex}rk = 1 – \frac{{6\left[ {141.5 + \frac{{{2^3} – 2}}{{12}} + \frac{{{3^2} – 3}}{{12}}} \right]}}{{{8^3} – 8}}{/tex}
{tex} = 1 – \frac{{6(141.5 + 0.5 + 2)}}{{504}}{/tex}
{tex} = 1 – \frac{{6 \times 144}}{{504}}{/tex}
{tex} = \frac{{504 – 864}}{{504}}{/tex}
{tex} = \frac{{ – 360}}{{504}}{/tex}
= -0.71 - Here, the mid-values are given so we need to convert it into continuous series. When middle points are given, we convert it into exclusive series noting the difference between each midpoint, we get the length of each interval as follows.
Marks Number of Students (f) 2.5-7.5 7 7.5-12.5 13 12.5-17.5 19 17.5-22.5 24 22.5-27.5 32 27.5-32.5 17 37.5-42.5 8 42.5-47.5 6 By inspection, we observe that the modal class is 22.5-27.5 as it has the highest frequency of 32.
{tex}\therefore{/tex} l1=225, f1=32, f0=24, f2=28, and c=5
Now, Mode (M0)={tex}l _ { 1 } + \frac { f _ { 1 } – f _ { 0 } } { 2 f _ { 1 } – f _ { 0 } – f _ { 2 } } \times c{/tex}
{tex}= 22.5 + \frac { 32 – 24 } { 2 \times 32 – 24 – 28 } \times 5{/tex}
{tex}= 22.5 + \frac { 8 } { 64 – 52 } \times 5{/tex}
{tex}= 22.5 + \frac { 40 } { 12 }{/tex}
=22.5+3.33
{tex}\Rightarrow{/tex}M0 = 25.83OR
Class Interval (X) Frequency (f) Cumulative Frequency (cf) 0-10 5 5 10-30 15 20 30-60 25 45 60-80 8 53 80-90 3 56 {tex}n = \Sigma f = 56{/tex} Here, n=56
{tex}\therefore m = \text { Size of } \left( \frac { n } { 2 } \right) \text { th item } = \left( \frac { 56 } { 2 } \right) th\ item{/tex}
28th item
cf just greater than 28 is 45 and the corresponding group is 30-60, hence median class is 30-60.
{tex}\therefore{/tex} cf=20, f=25, c=30(60-30) and l1=30
Now, {tex}M = l _ { 1 } + \frac { \frac { n } { 2 } – c f } { f } \times c{/tex}
{tex}= 30 + \left( \frac { 28 – 20 } { 25 } \right) \times 30{/tex}
{tex} = 30 + \frac { 240 } { 25 } = 30 + 9.6 = 39.6{/tex}
Therefore, the median of the following distribution of data = 39.6 - Section B
- (d) all of these
Explanation: Increase in supply refers to a situation when more is supplied at the existing price of the commodity. It leads to a forward shift in the supply curve. Increase in supply may occur due to improvement in technology, reduction in factor prices, a decrease in the price of a competing product etc.Prepare for your exams with the myCBSEguide App and myCBSEGuide Website, an all-in-one platform designed to support your academic journey. Whether you’re preparing for CBSE, NCERT, JEE (Main), NEET-UG, or NDA exams, this app offers a wide array of study materials, sample papers, and expert-curated resources to help you succeed. Stay on track with the right study content and clear your concepts efficiently, making exam preparation more streamlined and effective. The CBSE Sample Papers Class 11 Economics help students get accustomed to the exam pattern and types of questions.For teachers, the Examin8 App and Examin8 Website is a powerful tool that allows you to create custom mock tests and practice papers with your own name and logo. This app provides a unique opportunity for educators to design personalized assessments, making teaching more engaging and interactive. Whether you’re a student or a teacher, these apps are designed to enhance learning and improve exam performance.Get ready to boost your academic performance—download the myCBSEguide App and Examin8 App today!
- (b) Left
Explanation: Severe earthquake in a country leads to decline in both human as well as capital resources. As a result of which less resources are left for producing the goods. Thus decline in resources will lead to a leftward shift in the PPC. - (a) When demand for the commodity is perfectly inelastic
Explanation: When the demand for a commodity is perfectly inelastic the change in price will have no effect on the quantity demanded. The consumers do not change their demand due to the change in price. This usually is seen in case of necessities. Hence, the equilibrium quantity will be same the price might increase or decrease. - (a) MR will be constant but TR is a positively sloped straight line
Explanation: TR will increase with every increase in unit sold. So, it will be a positively sloped straight line. Whereas MR is the addition in revenue by selling one extra unit. Since price is constant, every extra unit sold will yield revenue equal to price. So, MR = Price and it will be a horizontal straight line. - (c) increasing
Explanation: MC is the rate of TC. If TC increases at increasing rate, MC must be increasing. - (d) A is false but R is true.
Explanation: The demand curve of the substitute good shifts to the right. Greater purchase of a commodity at its constant price points to a situation of increase in demand or a forward shift in the demand curve. - (d) a firm can sell any amount at the existing price
Explanation: Firm’s demand curve is a horizontal straight line under perfect competition. Demand curve of the firm is perfectly elastic. It means that the firm can sell any amount of the commodity at the prevailing price. The horizontal straight line shows that the firm is to accept the price as determined by the forces of market supply and market demand; it can sell whatever amount it wishes to sell at this price. - (c) Yes
Explanation: The MR curve slopes downward but at twice the rate of AR. When TR is maximum MR is zero. Any increase in output beyond the point where MR=0 leads to a negative MR. - (d) Imputed costs
Explanation: It is the cost of self supplied factors. - (a) Perfect competition
Explanation: As a firm under this competition is a price taker, i.e , which is fixed by the industry (demand and supply forces) . Therefore each firm is a price taker and faces a perfectly elastic demand curve. - There are three reasons which give rise to an economic problem.:
- Wants of people are unlimited – It is due to unending circle of wants. After the satisfaction of one wants, another want arises.
- Resources are limited – Problem of allocation of resources arises because resources are not enough to satisfy wants of every individual.
- Resources have alternative uses – Scarce resources have alternative uses. When an individual chooses to use a given resources for something, he/she is unable to use that resources for anything else.
OR
The central problems of a production deal with the production of necessary commodities using scarce means of resources. It includes problems that deal with the production of goods in an economy where it is decided that:
What to produce? Consumer goods or capital goods?
How to produce? Using labour intensive technique or capital intensive technique
For whom to produce? Rich people or poor people? - The following three conditions must hold if a profit-maximizing firm produces a positive level of output (say equilibrium output Q*) in a competitive market:
- MR must be equal to MC at Q*.
- MC should be upward sloping or rising at Q*.
- In short-run – Price must be greater than or equal to AVC. i.e. P {tex}\geq{/tex} AVC at Q*.
In the long run – Price must be greater than or equal to Long-run average cost.
- One should distinguish between ‘value-in-use’ and ‘market value’ of a commodity. Water has high ‘value-in-use’, of course. But its market value (price) is low (compared with diamonds) because it is available in plenty. In terms of its market supply, water is scarce, but not as scarce as diamonds.
Therefore, market price of water is much lower than of the diamonds. Imagine a situation when you are in a desert and you are dying to quench your thirst. You are then ready to pay any amount for a glass of water. - Producer’s equilibrium: It is a situation of profit maximisation.
- For attaining producer’s equilibrium, following two conditions are required to be satisfied :
- Marginal Revenue (MR) = Marginal Cost (MC), and
- Marginal Cost must be rising beyond the point of equilibrium.
- Following schedule explains the producer’s equilibrium:
Marginal Revenue and Cost Schedule Output Marginal Revenue (MR) (in Rs) Marginal Cost (MC) (in Rs) 1 12 15 2 12 12 3 12 10 4 12 9 5 12 8 6 12 7 7 12 8 8 12 9 9 12 10 10 12 12 (Producer’s equilibrium) 11 12 15 At 2nd level of output, Marginal Revenue and Margimal Cost are equal but at 3rd level of output Marginal Revenue > Marginal Cost (12 > 10). Hence, firms will continue to expand production as their profits are not yet maximised. Producer will be in equilibrium at 10th level of output because beyond this level, Marginal Cost exceeds Marginal Revenue.
OR
-
- At this point, where MR>MC both the equilibrium conditions (i) MR = MC (ii) MC should cut MR from below are not satisfied.
- The firm will try to be in equilibrium by expanding the output to the level, where MC = MR.
- The producer will get either maximum Profits or sets minimum losses at the Point of equality between MR and MC.
- At this point of equality of MR and MC, if the second condition of equilibrium is also satisfied only then the producer will be in equilibrium because MR = MC or equality between MR and MC is a necessary but not a sufficient condition of equilibrium.
- The producer will be in equilibrium only when the following two conditions are satisfied simultaneously.
- MR = MC
- MC should cut MR from below.
- Demand of a commodity is inversely related to its price can be explained with the help of the table given below:
Demand schedulePrice (Rs) Quantity demanded (units) 10 50 8 60 6 70 4 80 2 90 As per The Law of Diminishing Marginal Utility, a consumer consumes successive units of an identical commodity, then Marginal Utility derived from an additional unit goes on declining. This implies that as a consumer’s utility is declining, then he would not be willing to buy an additional unit at the same price. But, if the good is offered to him at a reduced price, then this will induce him to increase his consumption. So, we can say that price and demand of a commodity are inversely related due to Law of Diminishing Marginal Utility and consumer buys a good upto the point at which MU = Price.
- Law of variable proportion states the impact of change in units of a variable factor on the physical output. When more and more units of a variable factor are combined with a fixed factor then total product increases at increasing rate in the beginning, then increases at decreasing rate and finally it starts falling.
Phase I : TP increases at an increasing rate.
Phase II : TP increases at diminishing rate.
Phase III : TP falls.
Behaviour of MP
Phase I: MP increases and becomes maximum.
Phase II: MP decreases and becomes zero.
Phase III: MP becomes negativeMachine Unit of Labour TPP (Unit) MPP(Unit) 1 1 3 3 1 2 7 4 1 3 12 5 1 4 16 4 1 5 19 3 1 6 21 2 1 7 22 1 1 8 22 0 1 9 21 -1 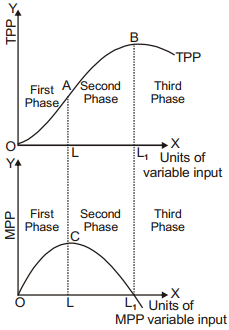
First Phase : TPP increases with increasing rate upto A point. MPP also increase and becomes maximum at point C.
Second Phase : TPP increases with diminishing rate and it is maximum at point B. MPP start to decline and becomes zero at D point.
Third Phase : TPP starts to decline and MPP becomes negative.- Important instruction for giving the answer of above question.
- Do not use diagram for the explanation of this question if it is instructed to use schedule and do not use schedule if the explanation of this question asked with the help of diagram.
- Do not explain the behaviour of marginal product with the help of schedule and diagram. If there is instruction to explain only the behaviour of total product.
- Do not explain the behaviour of total product with help of schedule and diagram if there is instruction to explain only the behaviour of marginal product.
- Answer the following questions
- Percentage Change in Demand {tex}= \frac { \text { Change in Demand } } { \text { Old Demand } } \times 100{/tex}
{tex}= \frac { 220 – 200 } { 200 } \times 100 = 10 \%{/tex}
Given,Percentage change in Price = 10%
Elasticity of Demand (Ed)
{tex}= ( – ) \frac { \text { Percentage change in quantity demanded } } { \text { Percentage change in price } }{/tex}
{tex}= ( – ) \frac { 10 } { 10 } = ( – 1 ){/tex}
{tex}\therefore{/tex}Ed = (-1) - Price elasticity of demand is an economic measure of the change in the quantity demanded or purchased of a product in relation to its price change.
{tex}\mathrm{E}_{\mathrm{d}}=\frac{\Delta \mathrm{Q}}{\mathrm{Q}} \times \frac{\mathrm{P}}{\Delta \mathrm{P}}{/tex}
{tex}\Delta Q{/tex}= 18 -18 = 0
{tex}\Delta P{/tex}= 10 – 9 = 1
P = 10
Q = 18
By substituting the values we get:
{tex}\mathrm{E}_{\mathrm{d}}=\frac{0}{18} \times \frac{10}{1}=\frac{0}{18}=0{/tex}
Perfectly inelastic demand.
- Percentage Change in Demand {tex}= \frac { \text { Change in Demand } } { \text { Old Demand } } \times 100{/tex}
CBSE Sample Papers for Class 11
- Physics
- Chemistry
- Mathematics
- Biology
- Accountancy
- Economics
- Business Studies
- Computer Science
- Informatics Practices
- English Core
- Hindi Core
- Hindi Elective
- History
- Political Science
- Geography
- Sociology
- Physical Education
- Other Subjects
Download sample papers for Class 11 in subjects like Physics, Chemistry, Biology, History, Political Science, Economics, Geography, Computer Science, Home Science, Accountancy, and Business Studies on the myCBSEguide App or myCBSEGuide website. Access expertly crafted sample papers with solutions, chapter-wise test papers, NCERT solutions, NCERT Exemplar solutions, and quick revision notes for easy reference. myCBSEguide also offers CBSE guess papers and important question papers to help you stay ahead in your studies. With comprehensive resources and user-friendly tools, the myCBSEguide App is the ultimate choice for CBSE students looking to excel in their exams. Download now! Solving CBSE Sample Papers Class 11 Economics regularly is crucial for thorough exam preparation.
Test Generator
Create question paper PDF and online tests with your own name & logo in minutes.
Create Now
Learn8 App
Practice unlimited questions for Entrance tests & government job exams at ₹99 only
Install Now