NCERT Solutions for Class 10 Maths Exercise 14.2 Class 10 Maths book solutions are available in PDF format for free download. These ncert book chapter wise questions and answers are very helpful for CBSE board exam. CBSE recommends NCERT books and most of the questions in CBSE exam are asked from NCERT text books. Class 10 Maths chapter wise NCERT solution for Maths Book for all the chapters can be downloaded from our website and myCBSEguide mobile app for free.
NCERT solutions for Maths Statistics Download as PDF
NCERT Solutions for Class 10 Maths Statistics
1. The following table shows the ages of the patients admitted in a hospital during a year:
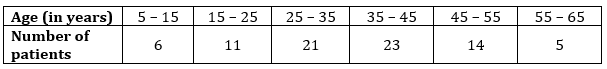
Find the mode and the mean of the data given above. Compare and interpret the two measures of central tendency.
Ans. For Mode: In the given data, maximum frequency is 23 and it corresponds to the class interval 35 – 45.
 Modal class = 35 – 45
And 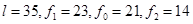 and
and 
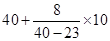
 Mode =
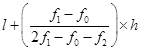
= 
= 
= 
= 35 + 1.8
= 36.8
For Mean:
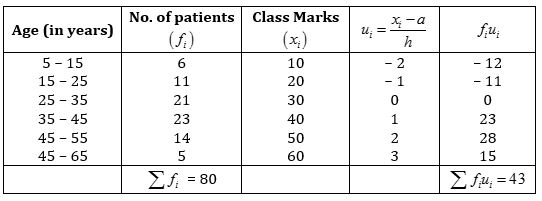
From given data, Assume mean  = 30, Width of the class
  = 10
= 10
 =
= 
Using formula, Mean  = 30 + 10 (0.5375) = 30 + 5.375 = 35.37
Hence mode of given data is 36.8 years and mean of the given data is 35.37 years.
Also, it is clear from above discussion that average age of a patient admitted in the hospital is 35.37 years and maximum number of patients admitted in the hospital are of age 36.8 years.
NCERT Solutions for Class 10 Maths Exercise 14.2
2. The following data gives the information on the observed lifetimes (in hours) of 225 electrical components:
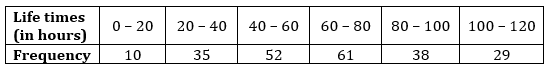
Determine the modal lifetimes of the components.
Ans. Given: Maximum frequency is 61 and it corresponds to the class interval 60 – 80.
Modal class = 60 – 80
And  and
and 
Mode =
= 
= 
= 
= 60 + 5.625
= 65.625
Hence modal lifetimes of the components is 65.625 hours.
NCERT Solutions for Class 10 Maths Exercise 14.2
3. The following data gives the distribution of total monthly household expenditure of 200 families of a village. Find the modal monthly expenditure of the families. Also find the mean monthly expenditure:
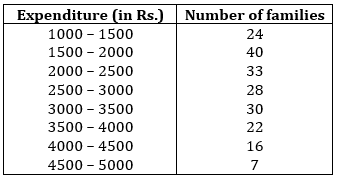
Ans. For Mode: Here, Maximum frequency is 40 and it corresponds to the class interval 1500 – 2000.
Modal class = 1500 – 2000
And 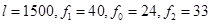 and
and 
Mode =
= 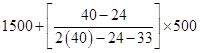
= 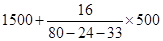
= 
= 1500 + 347.83
= 1847.83
For Mean:
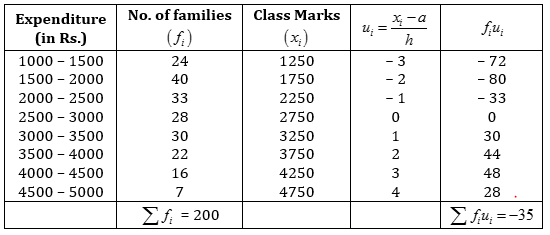
From given data, Assume mean = 2750, Width of the class = 500
= 
Using formula, Mean = 2750 + 500 (– 0.175) = 2750 – 87.50 = 2662.50
Hence the modal monthly expenditure of family is Rs. 1847.83 and the mean monthly expenditure is Rs. 2662.50.
NCERT Solutions for Class 10 Maths Exercise 14.2
4. The following distribution gives the state-wise teacher-student ratio in higher secondary schools of India. Find the mode and mean of this data. Interpret the two measures.
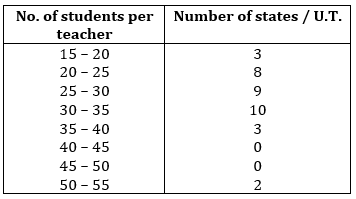
Ans. For Mode: Here, Maximum frequency is 10 and it corresponds to the class interval 30 – 35.
Modal class = 30 – 35
And 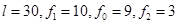 and
and 
Mode = = 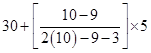
= 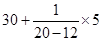 =
=  = 30 + 0.625 = 30.63 (approx.)
For Mean:
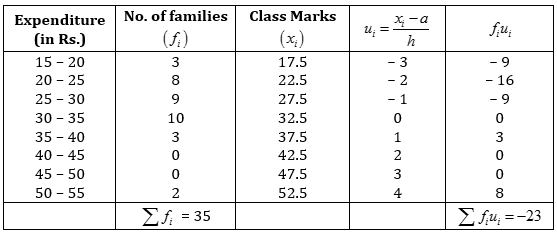
From given data, Assume mean = 32.5, Width of the class = 5
= 
Using formula, Mean = 32.5 + 5 (– 0.65) = 32.5 – 3.25 = 29.25 (approx.)
Hence mode and mean of given data is 30.63 and 29.25. Also from above discussion, it is clear that states/U.T. have students per teacher is 30.63 and on average, this ratio is 29.25.
NCERT Solutions for Class 10 Maths Exercise 14.2
5. The given distribution shows the number of runs scored by some top batsmen of the world in one-day cricket matches:
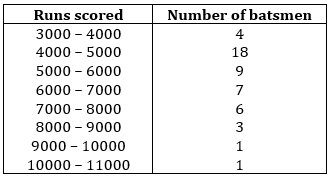
Find mode of the data.
Ans. In the given data, maximum frequency is 18 and it corresponds to the class interval 4000 – 5000.
Modal class = 4000 – 5000
And 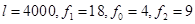 and
and 
Mode =
= 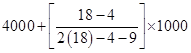
= 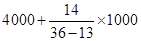
= 
= 4000 + 608.6956
= 4608.7 (approx.)
Hence, mode of the given data is 4608.7 runs.
NCERT Solutions for Class 10 Maths Exercise 14.2
6. A student noted the number of cars passing through a spot on a road for 100 periods each of 3 minutes and summarized it in the table given below:
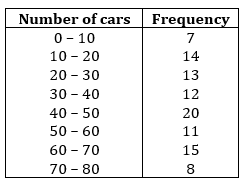
Find the mode of the data.
Ans. In the given data, maximum frequency is 20 and it corresponds to the class interval 40 – 50.
Modal class = 40 – 50
And 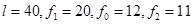 and
and
Mode =
= 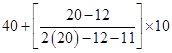
= 
=  = 40 + 4.70588 = 44.7 (approx.)
Hence, mode of the given data is 44.7 cars.
NCERT Solutions for Class 10 Maths Exercise 14.2
NCERT Solutions Class 10 Maths PDF (Download) Free from myCBSEguide app and myCBSEguide website. Ncert solution class 10 Maths includes text book solutions from Mathematics Book. NCERT Solutions for CBSE Class 10 Maths have total 15 chapters. 10 Maths NCERT Solutions in PDF for free Download on our website. Ncert Maths class 10 solutions PDF and Maths ncert class 10 PDF solutions with latest modifications and as per the latest CBSE syllabus are only available in myCBSEguide.
CBSE app for Class 10
To download NCERT Solutions for Class 10 Maths, Computer Science, Home Science,Hindi ,English, Social Science do check myCBSEguide app or website. myCBSEguide provides sample papers with solution, test papers for chapter-wise practice, NCERT solutions, NCERT Exemplar solutions, quick revision notes for ready reference, CBSE guess papers and CBSE important question papers. Sample Paper all are made available through the best app for CBSE
Test Generator
Create question paper PDF and online tests with your own name & logo in minutes.
Create Now
Learn8 App
Practice unlimited questions for Entrance tests & government job exams at ₹99 only
Install Now